

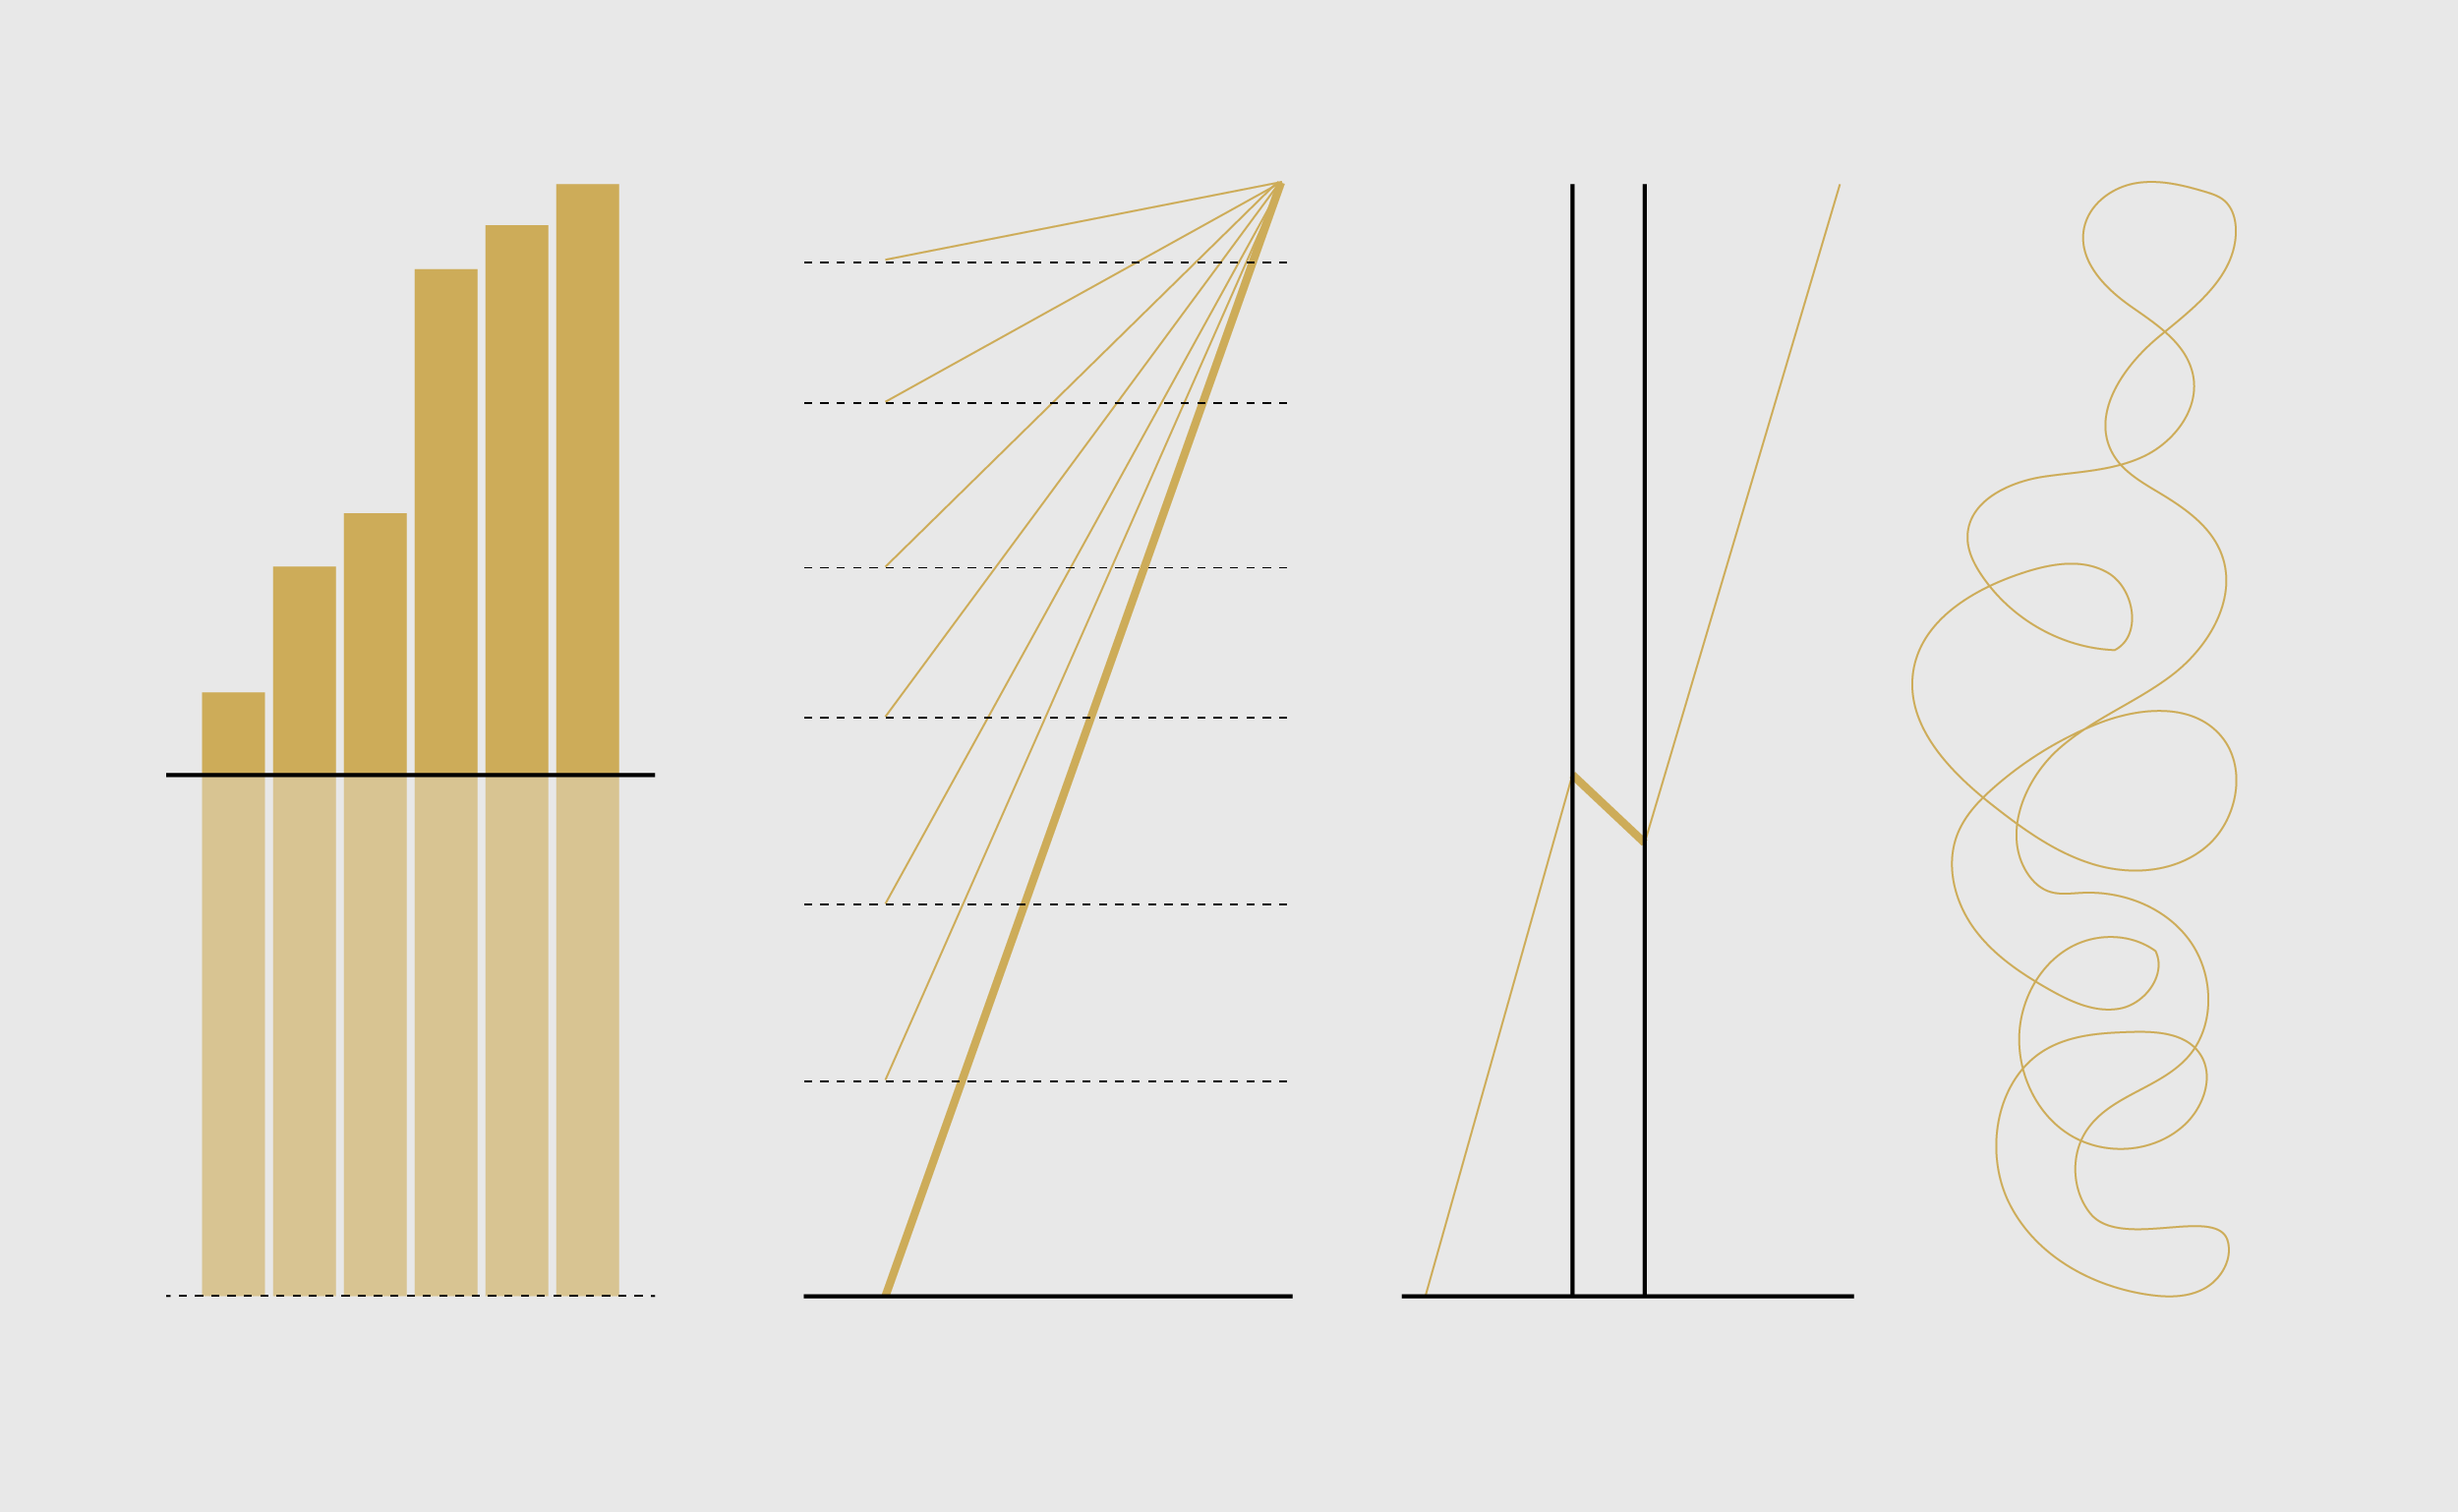
Three common ways data visualizations can mislead.
Defense Against Dishonest Charts
This is a guide to protect ourselves and to preserve what is good about turning data into visual things.
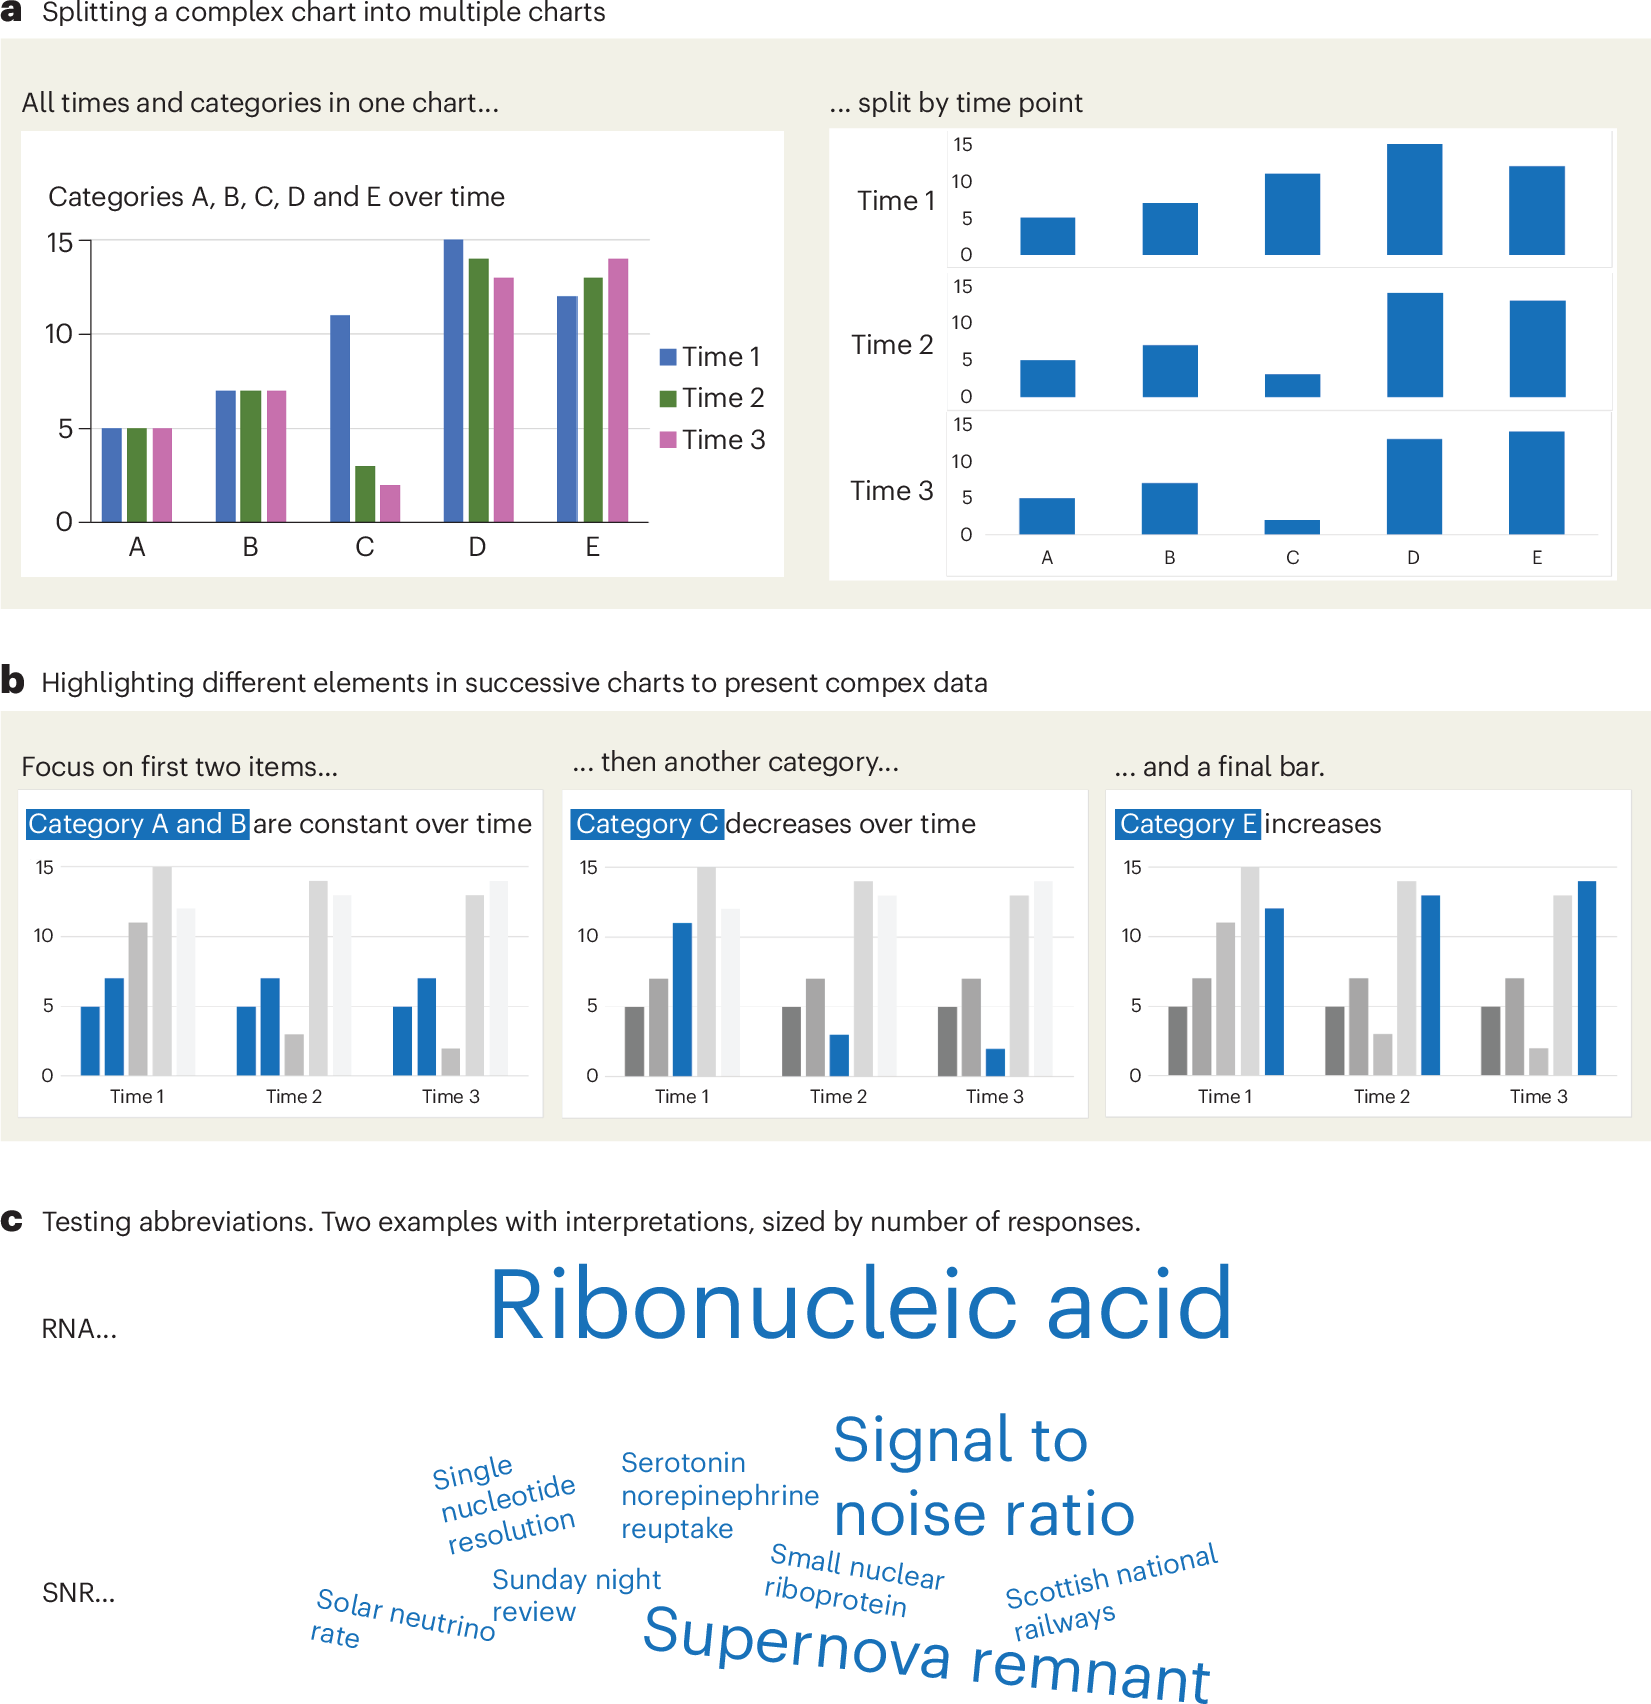
A checklist for designing and improving the visualization of scientific data
Creating clear and engaging scientific figures is crucial to communicate complex data. In this Comment, I condense principles from design, visual perception and data visualization research in a checklist that can help researchers to improve their data visualization, by focusing on clarity, accessibility and design best practices.
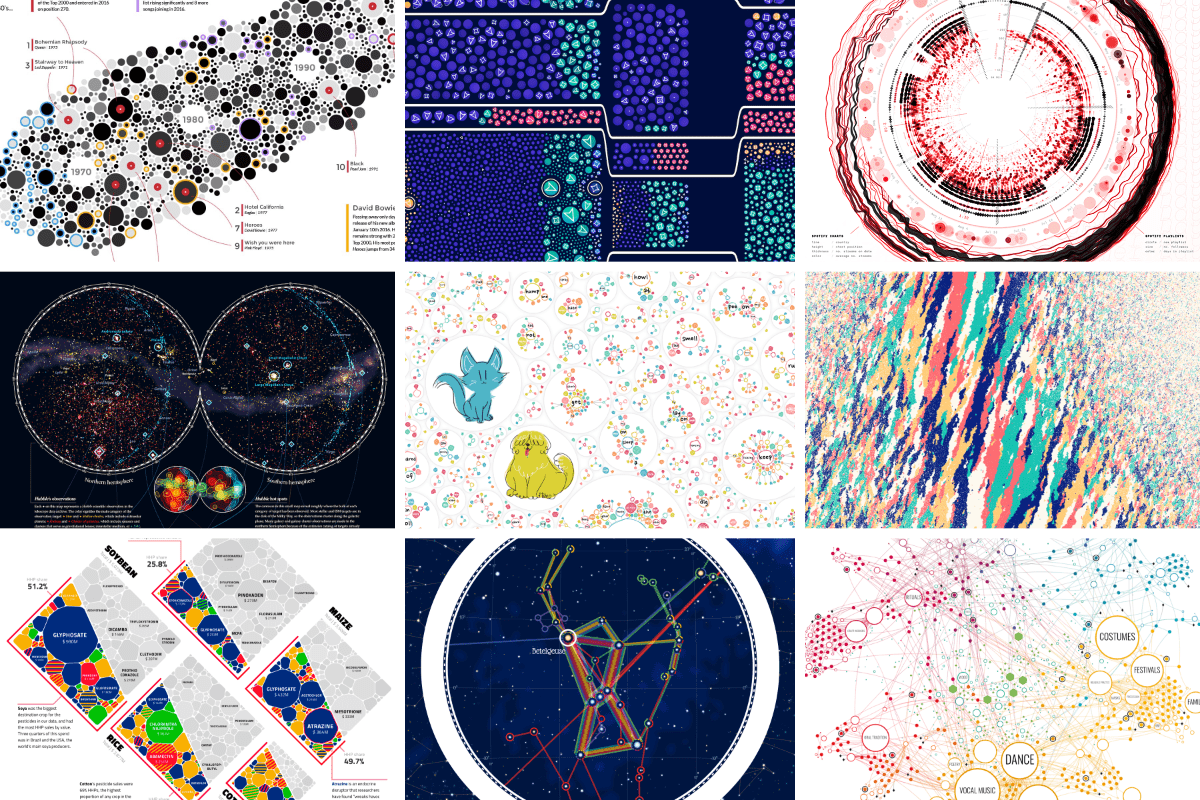
An Award-winning Data Visualization Designer
Visual Cinnamon | Data Visualization Design & Data Art | Data made insightful, effective & beautiful through data visualization and data art
On power, aesthetics, materiality and change in data visualization
Notes from the Information+ Conference at MIT/Northeastern University, Boston.
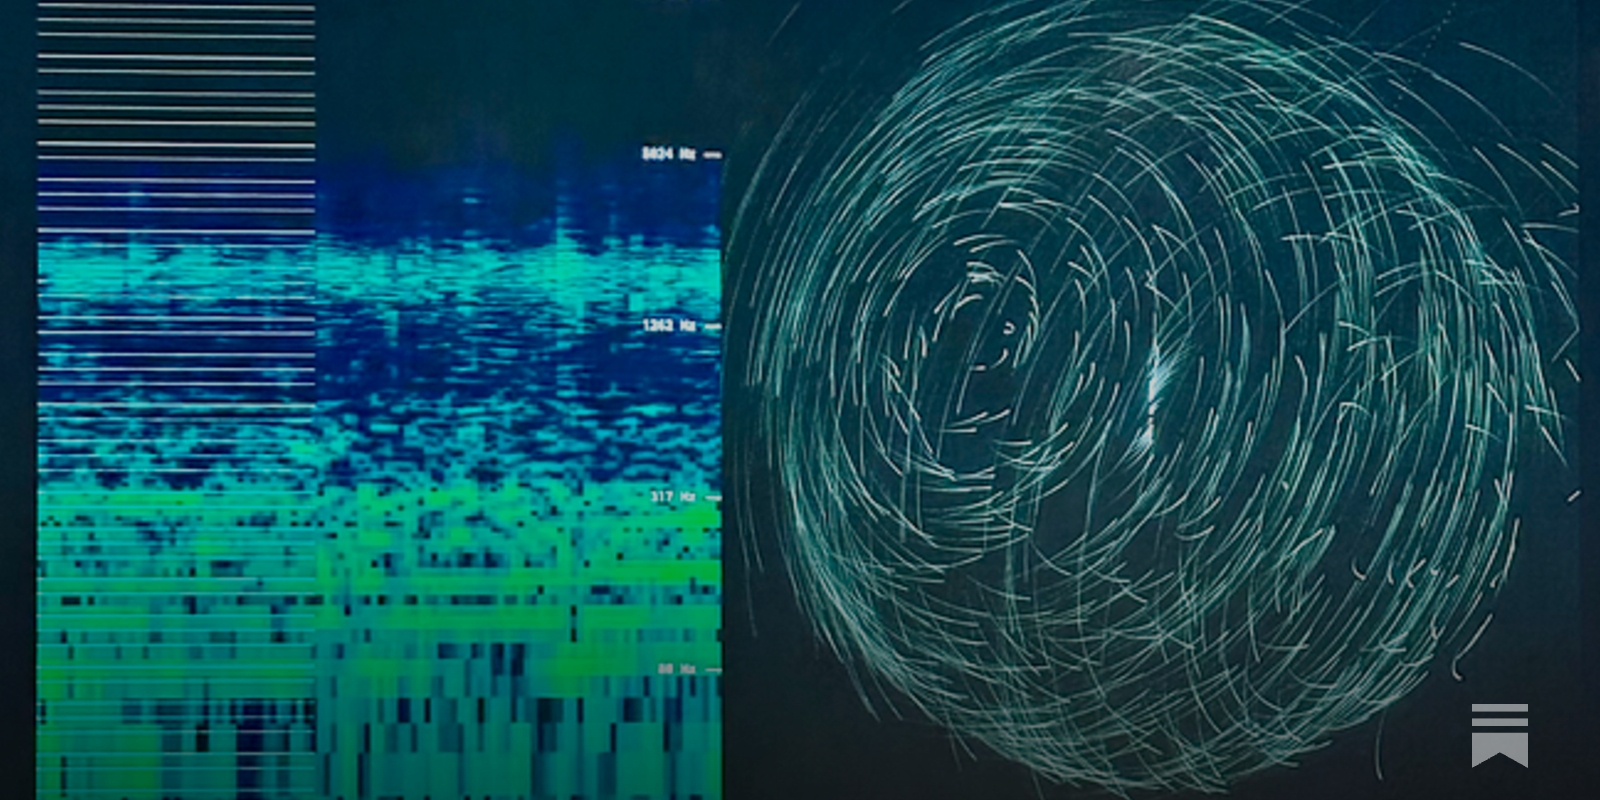
Information is Beautiful
Distilling the world's data, information & knowledge into beautiful infographics & visualizations

visualising data structures and algorithms through animation - VisuAlgo
VisuAlgo was conceptualised in 2011 by Associate Professor Steven Halim (NUS School of Computing) as a tool to help his students better understand data structures and algorithms, by allowing them to learn the basics on their own and at their own pace. Together with his students from the National University of Singapore, a series of visualizations were developed and consolidated, from simple sorting algorithms to complex graph data structures. Though specifically designed for the use of NUS students taking various data structure and algorithm classes (CS1010/equivalent, CS2040/equivalent (inclusive of IT5003)), CS3230, CS3233, and CS4234), as advocators of online learning, we hope that curious minds around the world will find these visualizations useful as well.
Chart Design Principles | Hands-On Data Visualization
Tell your story and show it with data, using free and easy-to-learn tools on the web. This introductory book teaches you how to design interactive charts and customized maps for your website, beginning with easy drag-and-drop tools, such as Google Sheets, Datawrapper, and Tableau Public. You will also gradually learn how to edit open-source code templates built with Chart.js, Highcharts, and Leaflet on GitHub. Follow along with the step-by-step tutorials, real-world examples, and online resources. This book is ideal for students, non-profit organizations, small business owners, local governments, journalists, academics, or anyone who wants to tell their story and show the data. No coding experience is required.
Data Visualization with JavaScript
It’s getting hard to ignore the importance of data in our lives. Data is critical to the largest social organizations in human history. It can affect even the least consequential of our everyday decisions. And its collection has widespread geopolitical implications. Yet it also seems to be getting easier to ignore the data itself. One estimate suggests that 99.5% of the data our systems collect goes to waste. No one ever analyzes it effectively.
DR Group
For high-dimensional data, dimensionality reduction (DR) methods have been invaluable tools for human understanding, as they can map datasets into two or three dimensions for visualization, providing an intuitive way to understand the data. In recent years, tons of DR methods for data visualization have been proposed, and some are much better than others. In this blog post, we explore several DR methods, discuss how to determine which methods are effective, and explain why some are better than others.
GitHub - observablehq/plot: A concise API for exploratory data visualization implementing a layered grammar of graphics
A concise API for exploratory data visualization implementing a layered grammar of graphics - observablehq/plot
Create Elegant Data Visualisations Using the Grammar of Graphics
A system for declaratively creating graphics, based on "The Grammar of Graphics". You provide the data, tell ggplot2 how to map variables to aesthetics, what graphical primitives to use, and it takes care of the details.
The Gardener’s Vision of Data — Real Life
Data science reduces people to subjects that can be mined for truth

Show me the data - Design Notes
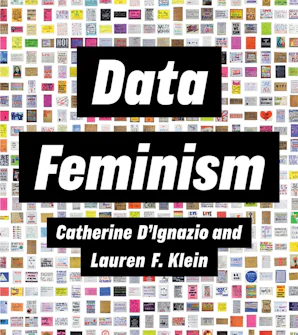
Data Feminism
Today, data science is a form of power. It has been used to expose injustice, improve health outcomes, and topple governments. But it has also been used to d...