

It’s getting hard to ignore the importance of data in our lives. Data is critical to the largest social organizations in human history. It can affect even the least consequential of our everyday decisions. And its collection has widespread geopolitical implications. Yet it also seems to be getting easier to ignore the data itself. One estimate suggests that 99.5% of the data our systems collect goes to waste. No one ever analyzes it effectively.
Chart Design Principles | Hands-On Data Visualization
Tell your story and show it with data, using free and easy-to-learn tools on the web. This introductory book teaches you how to design interactive charts and customized maps for your website, beginning with easy drag-and-drop tools, such as Google Sheets, Datawrapper, and Tableau Public. You will also gradually learn how to edit open-source code templates built with Chart.js, Highcharts, and Leaflet on GitHub. Follow along with the step-by-step tutorials, real-world examples, and online resources. This book is ideal for students, non-profit organizations, small business owners, local governments, journalists, academics, or anyone who wants to tell their story and show the data. No coding experience is required.
A checklist for designing and improving the visualization of scientific data
Creating clear and engaging scientific figures is crucial to communicate complex data. In this Comment, I condense principles from design, visual perception and data visualization research in a checklist that can help researchers to improve their data visualization, by focusing on clarity, accessibility and design best practices.
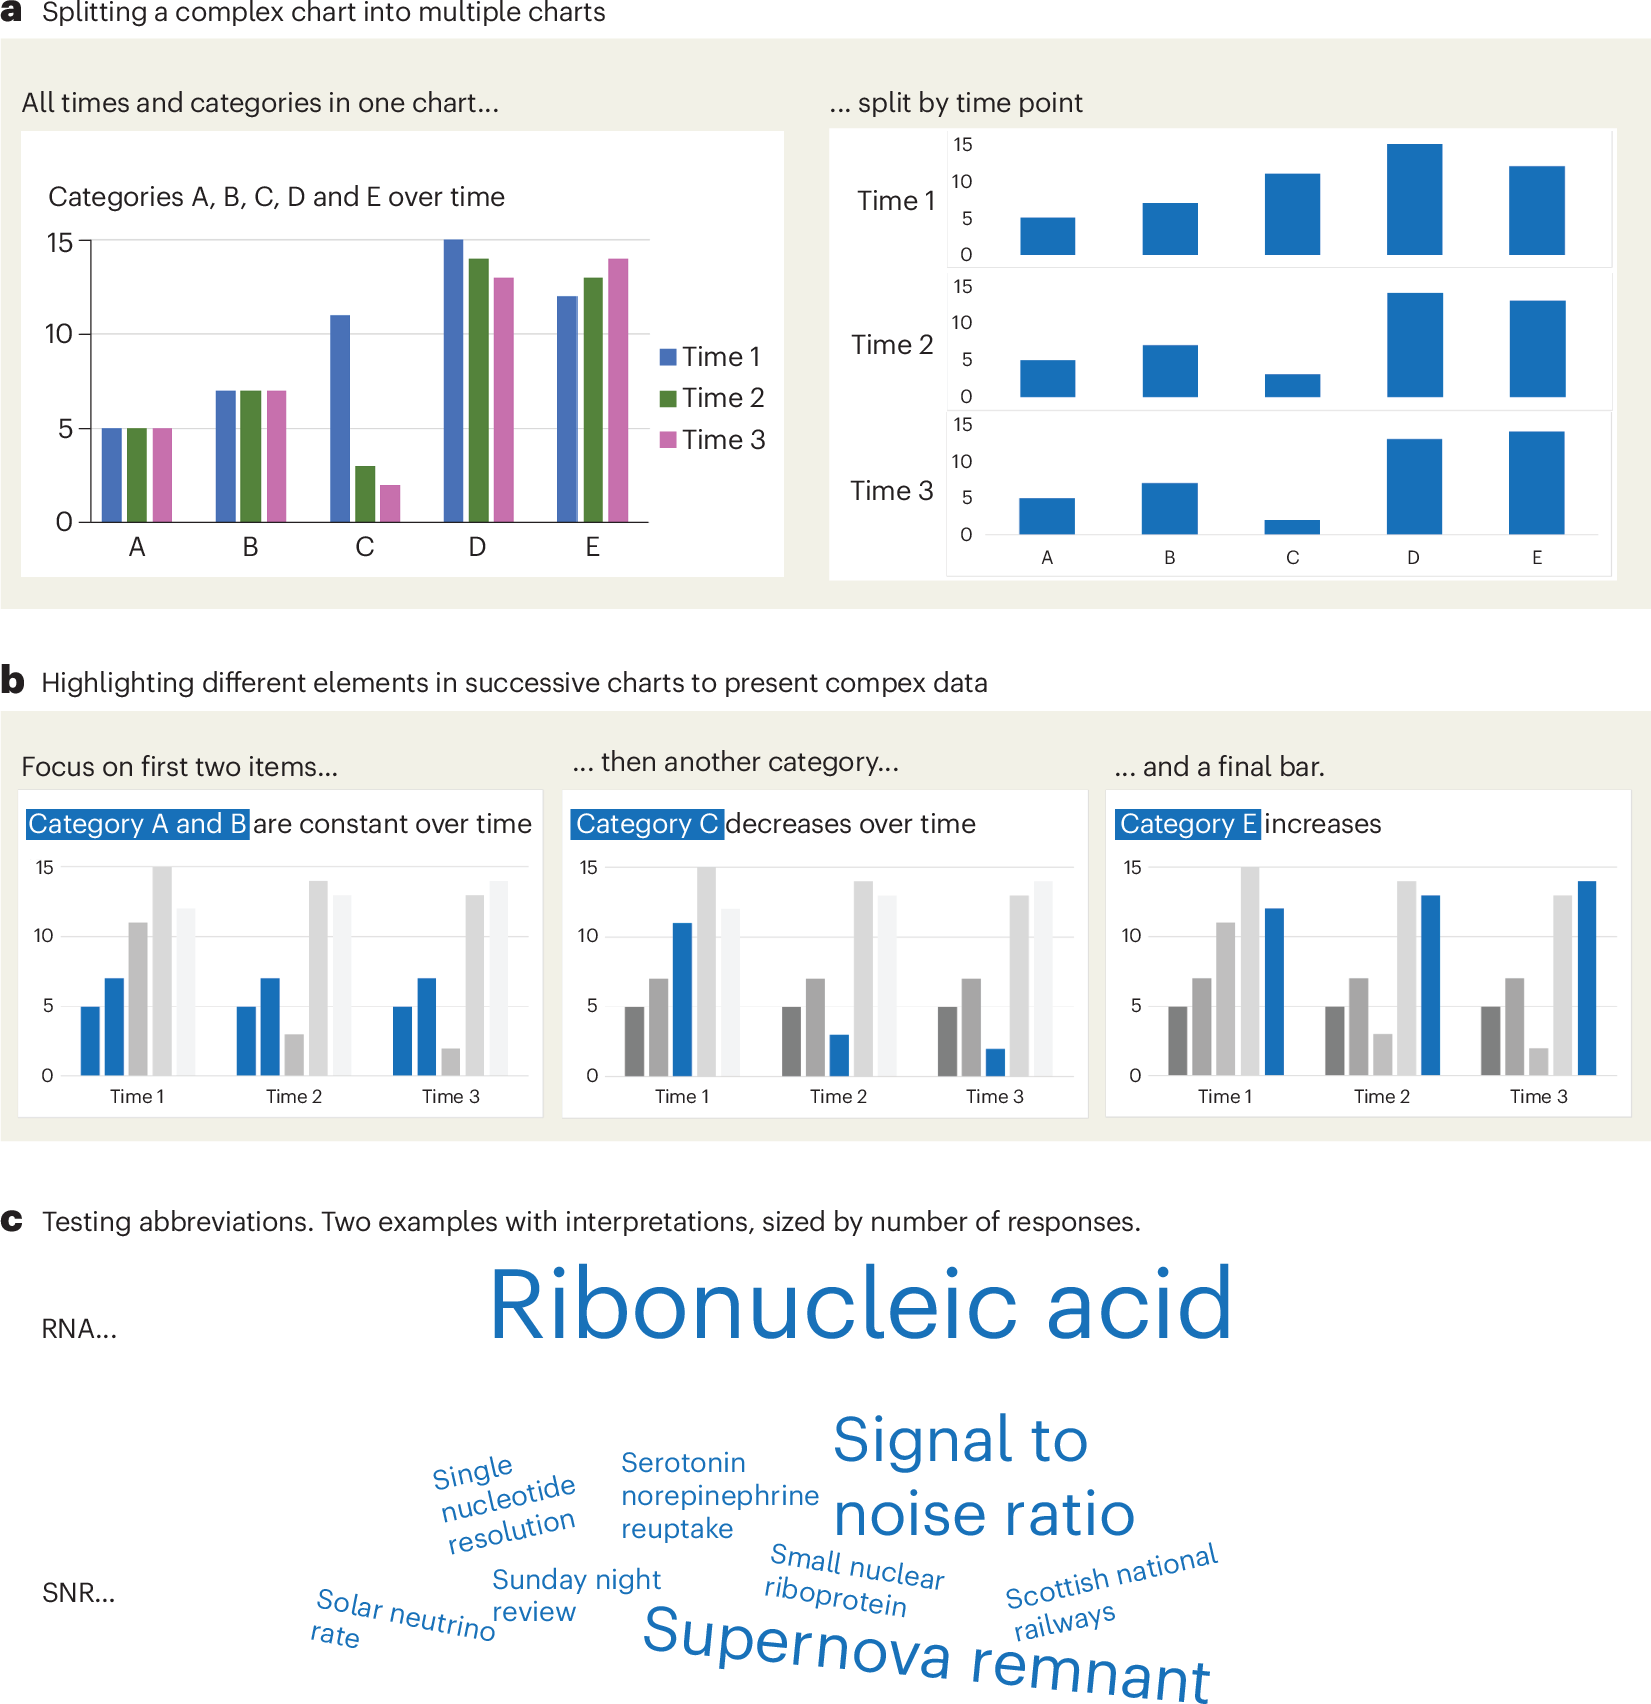
Defense Against Dishonest Charts
This is a guide to protect ourselves and to preserve what is good about turning data into visual things.
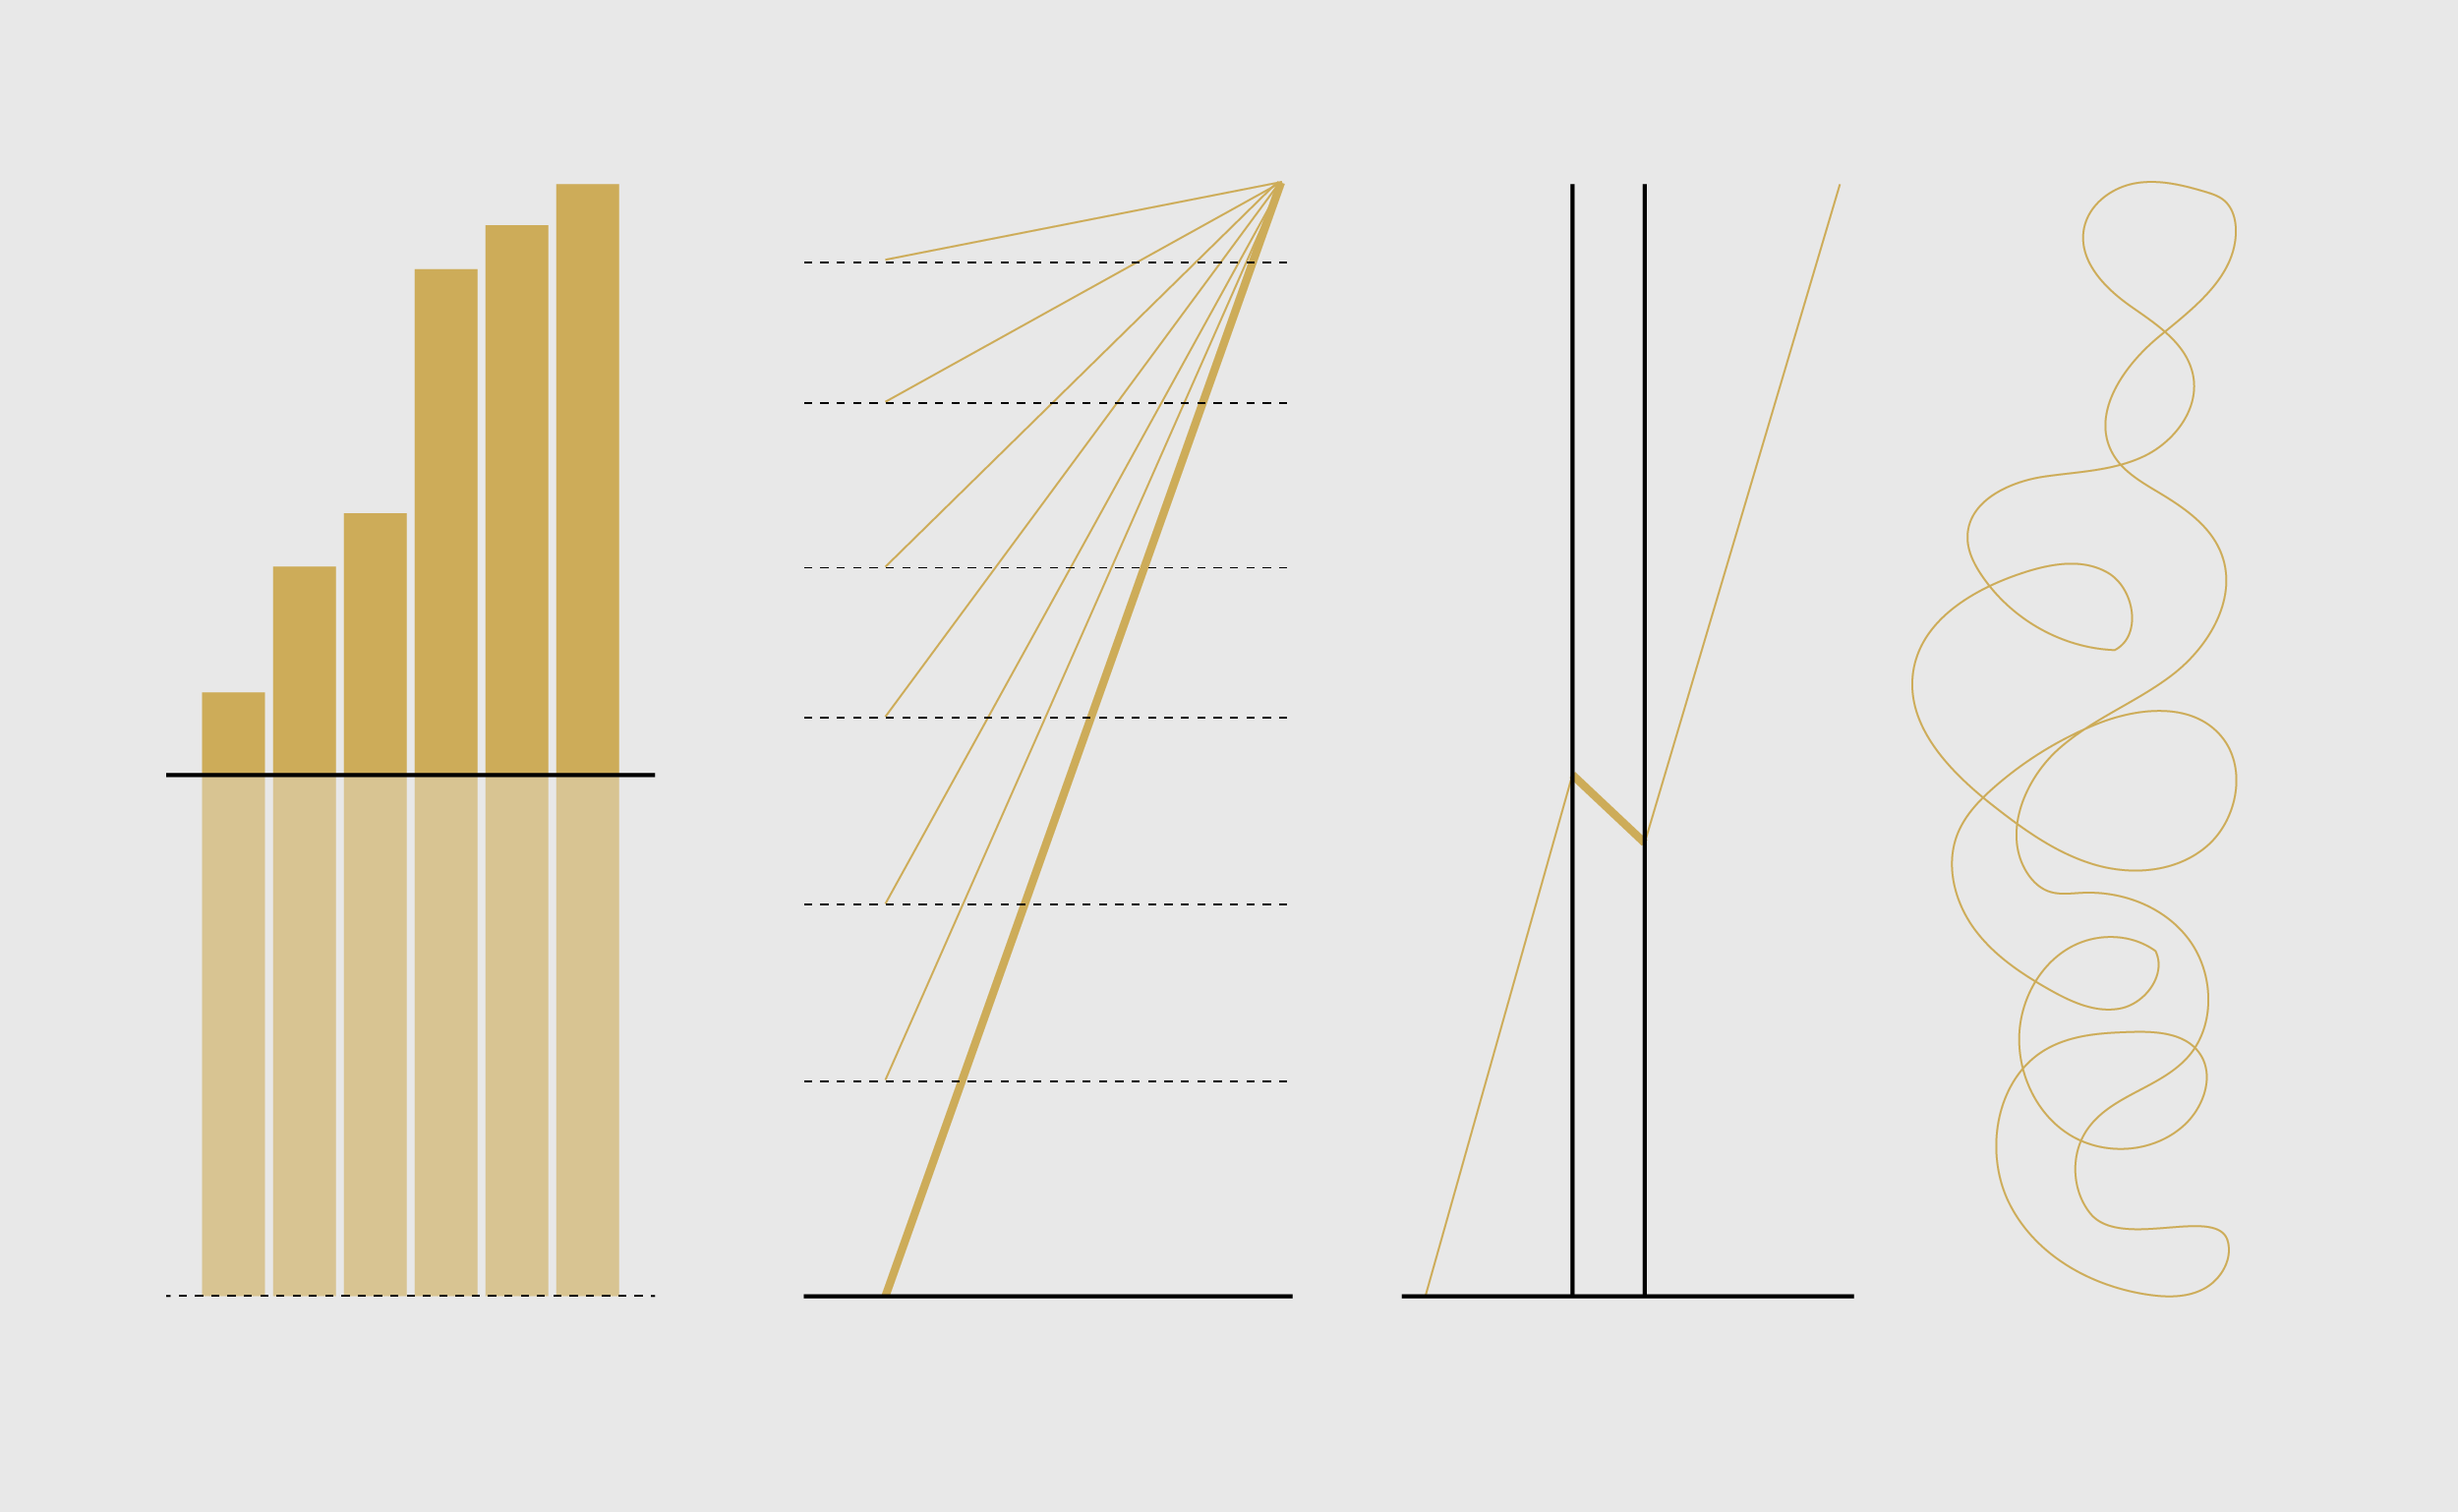
Information is Beautiful
Distilling the world's data, information & knowledge into beautiful infographics & visualizations

How to Lie with Data Visualization
Three common ways data visualizations can mislead.

Sigma.js
a JavaScript library aimed at visualizing graphs of thousands of nodes and edges
An Award-winning Data Visualization Designer
Visual Cinnamon | Data Visualization Design & Data Art | Data made insightful, effective & beautiful through data visualization and data art
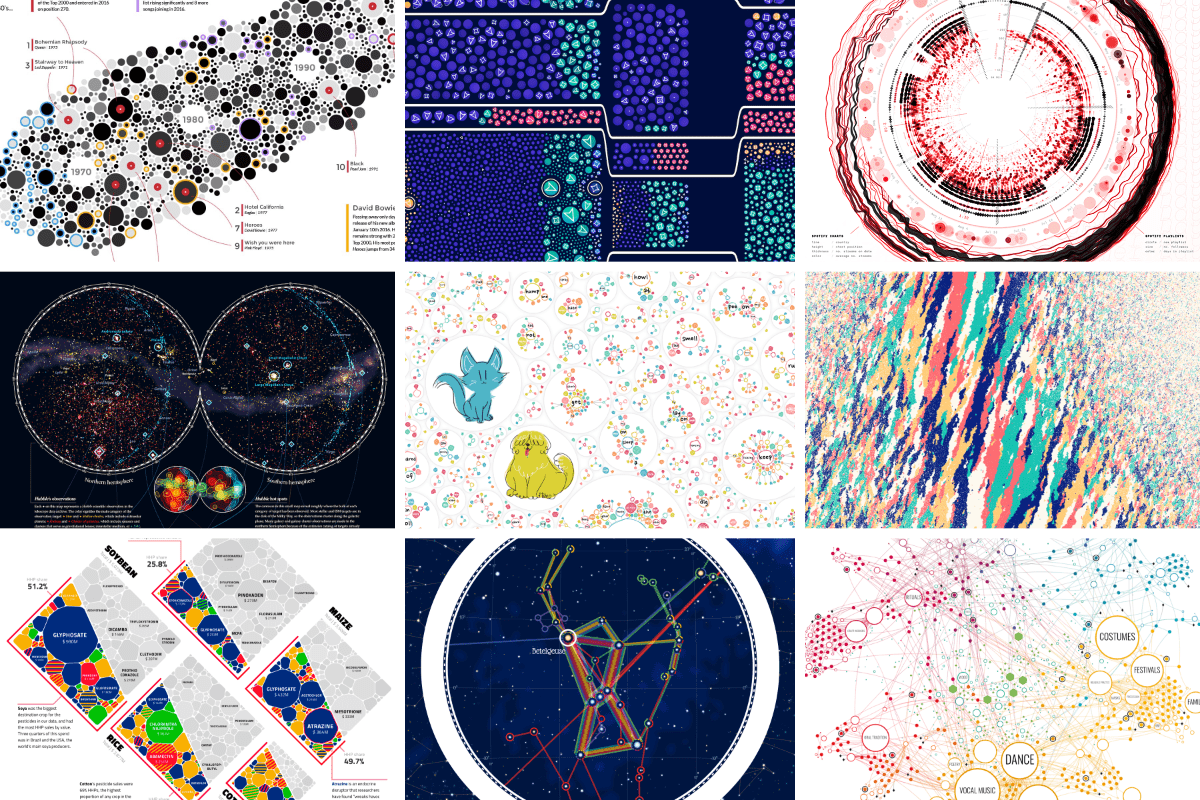
On power, aesthetics, materiality and change in data visualization
Notes from the Information+ Conference at MIT/Northeastern University, Boston.
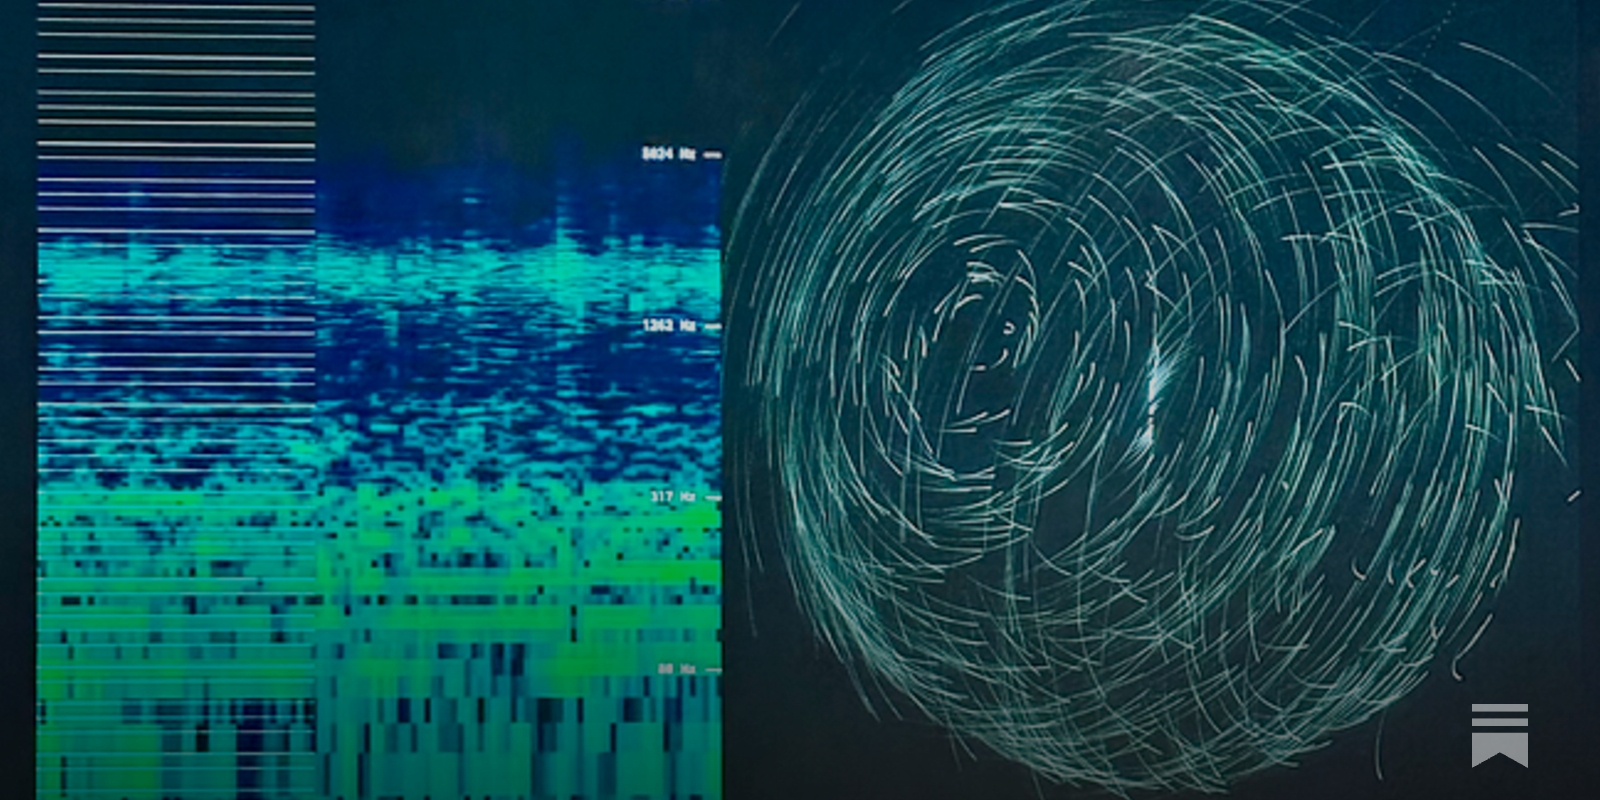
A Web of Data
Thoughts on making a "Web of Data" instead of a "Web of Pages", and how that might let us take a step away from the dominance of large, complicated browsers.
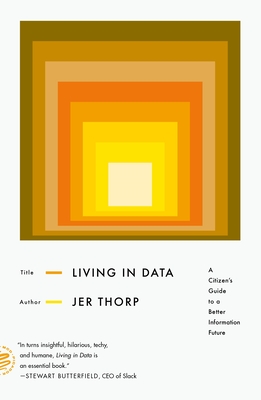
Living in Data: A Citizen's Guide to a Better Information Future (Paperback)
Jer Thorp’s analysis of the word “data” in 10,325 New York Times stories written between 1984 and 2018 shows a distinct trend: among the words most closely associated with “data,” we find not only its classic companions “information” and “digital,” but also a variety of new neighbors—from “scandal” and “misinformation” to “ethics,” “friends,” and “play.”To live in data in the twenty-first century
Reframing our relation to our data | Ronen Tamari
From data as digital exhaust to data as digital trails to collective wisdom.

GitHub - observablehq/plot: A concise API for exploratory data visualization implementing a layered grammar of graphics
A concise API for exploratory data visualization implementing a layered grammar of graphics - observablehq/plot
Linked Data is a Political Agenda
tfw @aaronstevenwhite.io brings an analysis as sharp as a knife to your half-baked Saturday-morning thoughts: aaronstevenwhite.leaflet.pub/3miwsz2hdv22i 🤯 If we're going to own our data, let's actually own our data. Which is to say: No, really, y'all, we're doing this. 💖🧠

Machine-readable attitudes - Computational Semantics++
aaronstevenwhite.leaflet.pubReally cool idea 🤯 - Install this web font - Just add plain text to the DOM - It renders a chart using font ligatures No JS, no hydration FOUC franktisellano.github.io/datatype/

