

visualising data structures and algorithms through animation - VisuAlgo
VisuAlgo was conceptualised in 2011 by Associate Professor Steven Halim (NUS School of Computing) as a tool to help his students better understand data structures and algorithms, by allowing them to learn the basics on their own and at their own pace. Together with his students from the National University of Singapore, a series of visualizations were developed and consolidated, from simple sorting algorithms to complex graph data structures. Though specifically designed for the use of NUS students taking various data structure and algorithm classes (CS1010/equivalent, CS2040/equivalent (inclusive of IT5003)), CS3230, CS3233, and CS4234), as advocators of online learning, we hope that curious minds around the world will find these visualizations useful as well.
Flint: A Visualization Language for the AI Era

Datasheets for Datasets
The machine learning community currently has no standardized process for documenting datasets, which can lead to severe consequences in high-stakes domains. To address this gap, we propose...

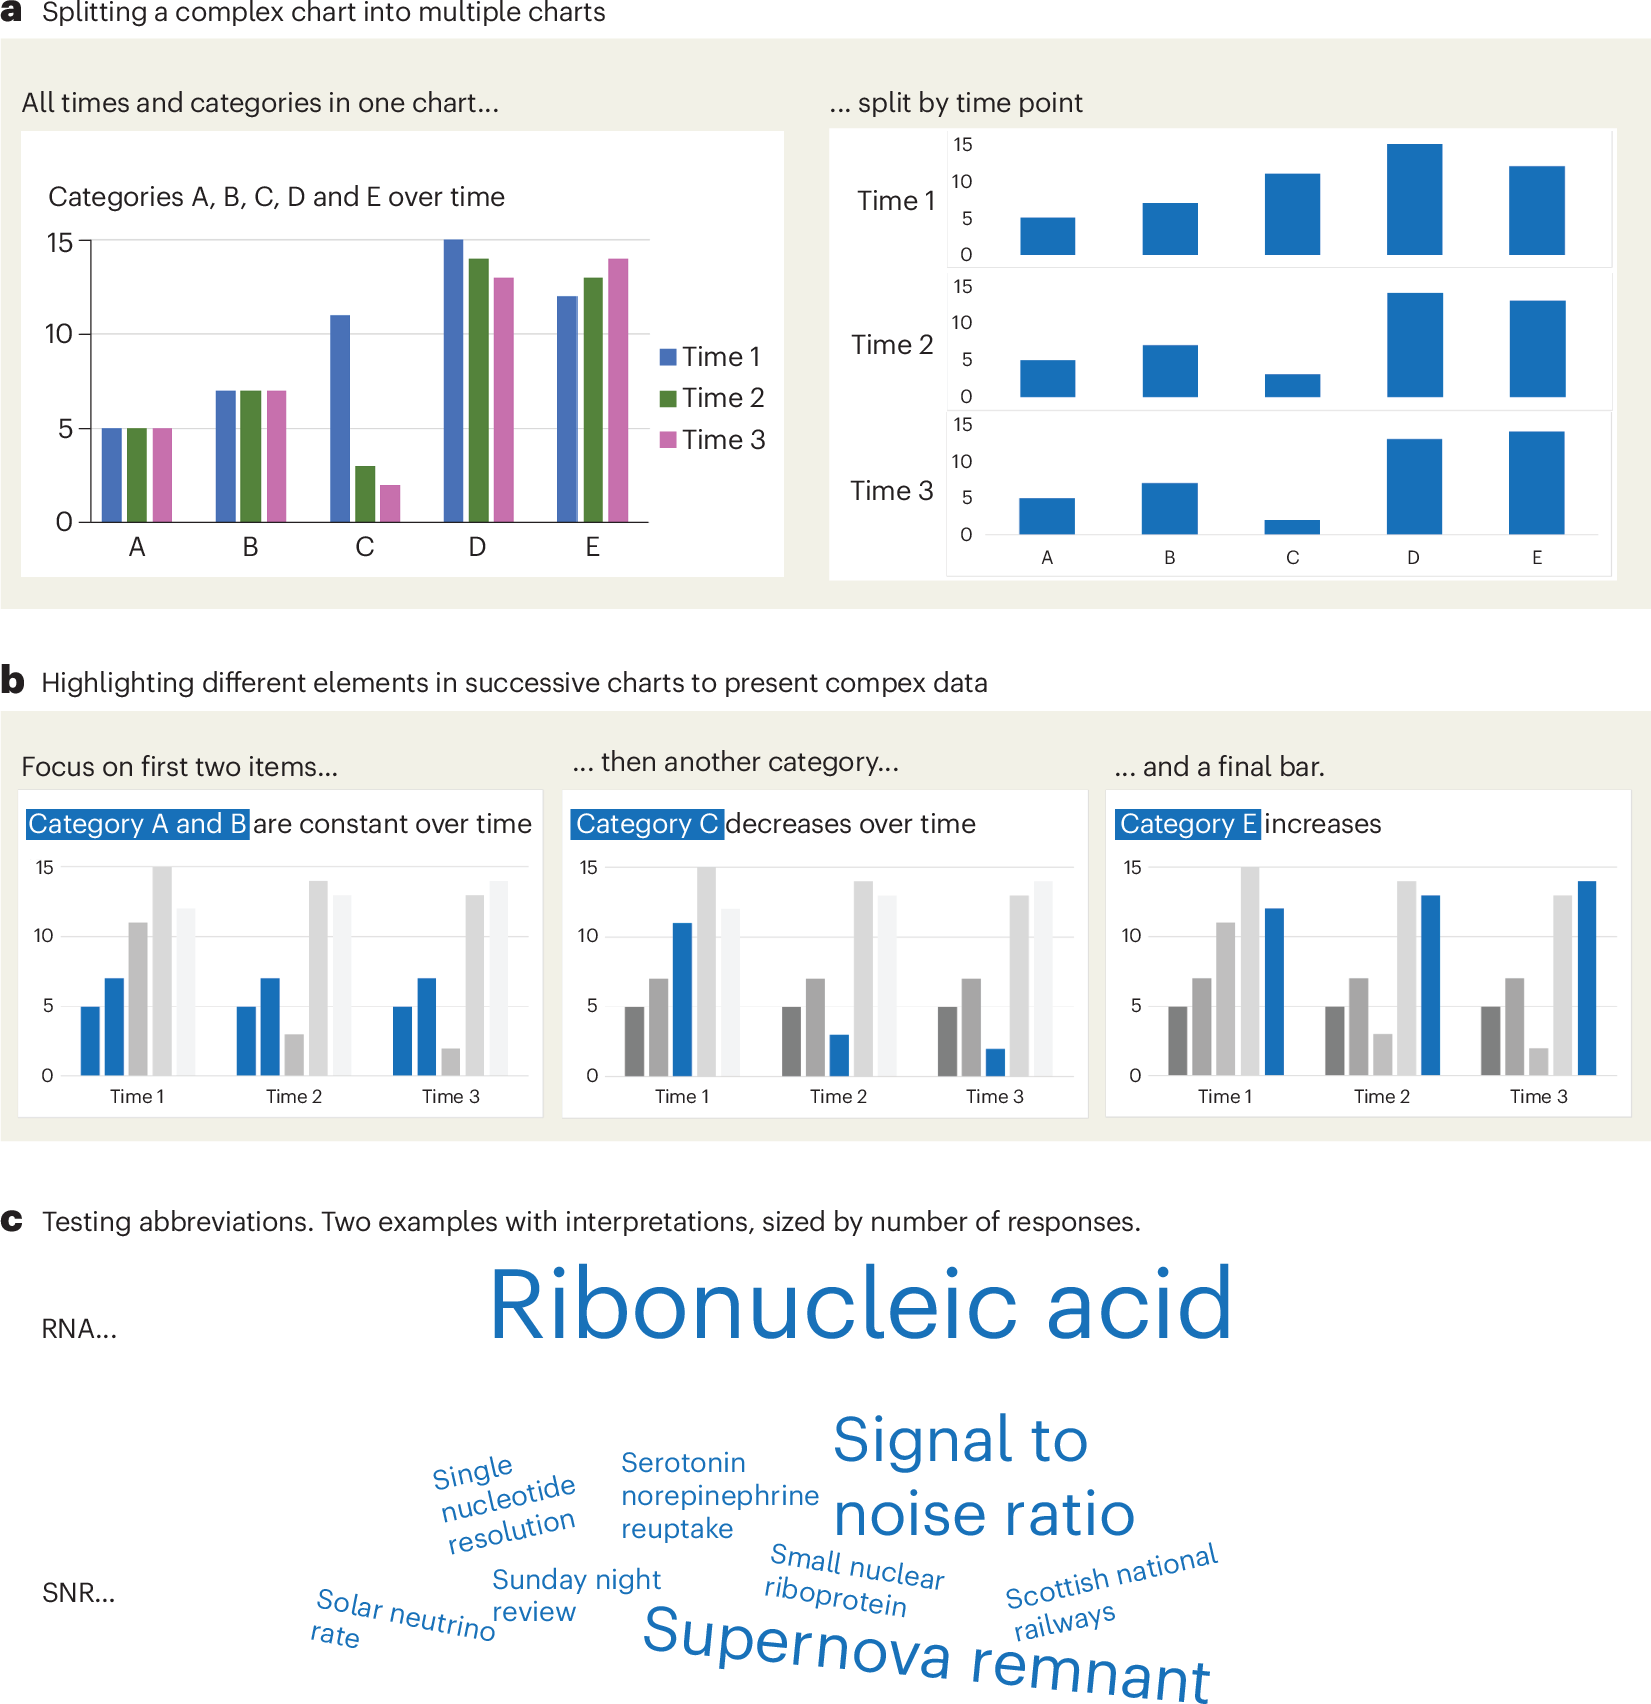
A checklist for designing and improving the visualization of scientific data
Creating clear and engaging scientific figures is crucial to communicate complex data. In this Comment, I condense principles from design, visual perception and data visualization research in a checklist that can help researchers to improve their data visualization, by focusing on clarity, accessibility and design best practices.
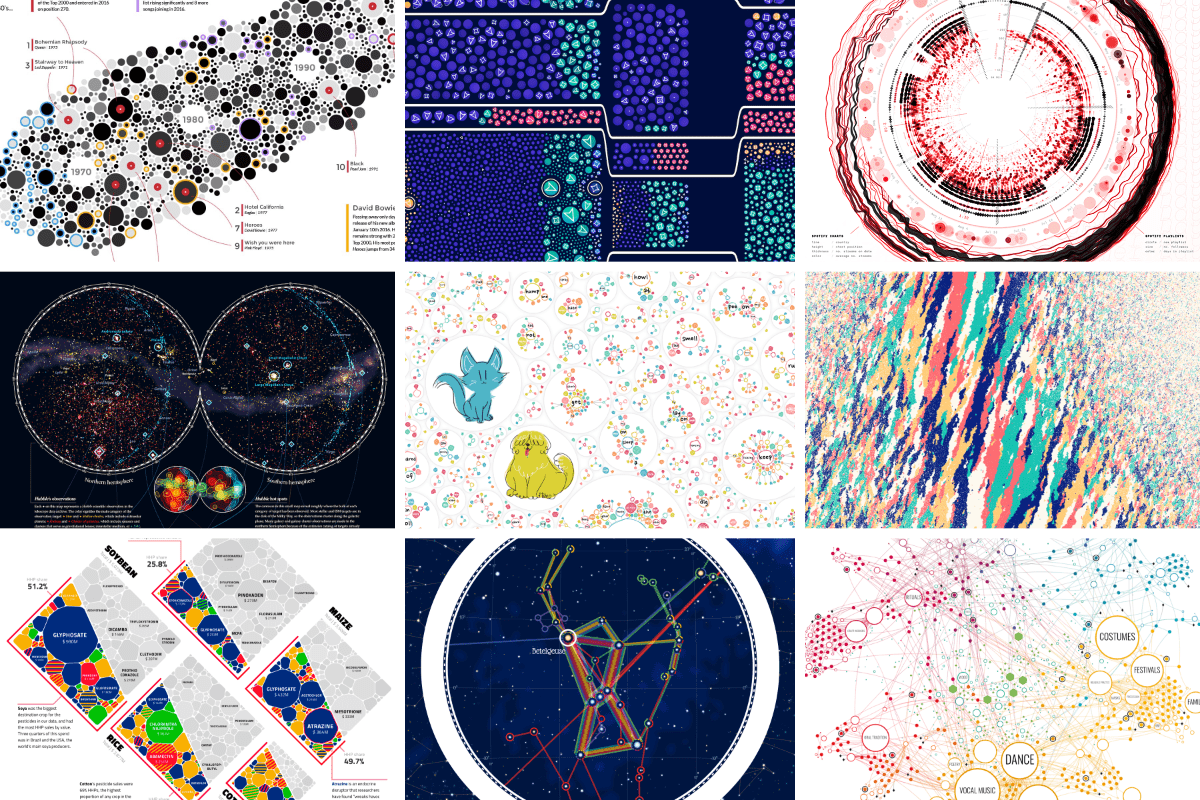
An Award-winning Data Visualization Designer
Visual Cinnamon | Data Visualization Design & Data Art | Data made insightful, effective & beautiful through data visualization and data art
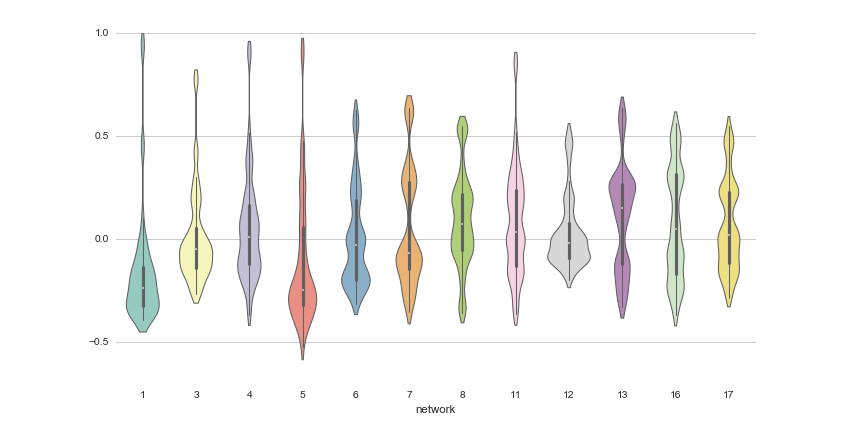
DR Group
For high-dimensional data, dimensionality reduction (DR) methods have been invaluable tools for human understanding, as they can map datasets into two or three dimensions for visualization, providing an intuitive way to understand the data. In recent years, tons of DR methods for data visualization have been proposed, and some are much better than others. In this blog post, we explore several DR methods, discuss how to determine which methods are effective, and explain why some are better than others.
Sigma.js
a JavaScript library aimed at visualizing graphs of thousands of nodes and edges
On power, aesthetics, materiality and change in data visualization
Notes from the Information+ Conference at MIT/Northeastern University, Boston.

12 Python Data Visualization Libraries to Explore for Business Analysis | Mode
This list is an overview of 10 interdisciplinary Python data visualization libraries including matplotlib, Seaborn, Plotly, Bokeh, pygal, geoplotlib, & more.
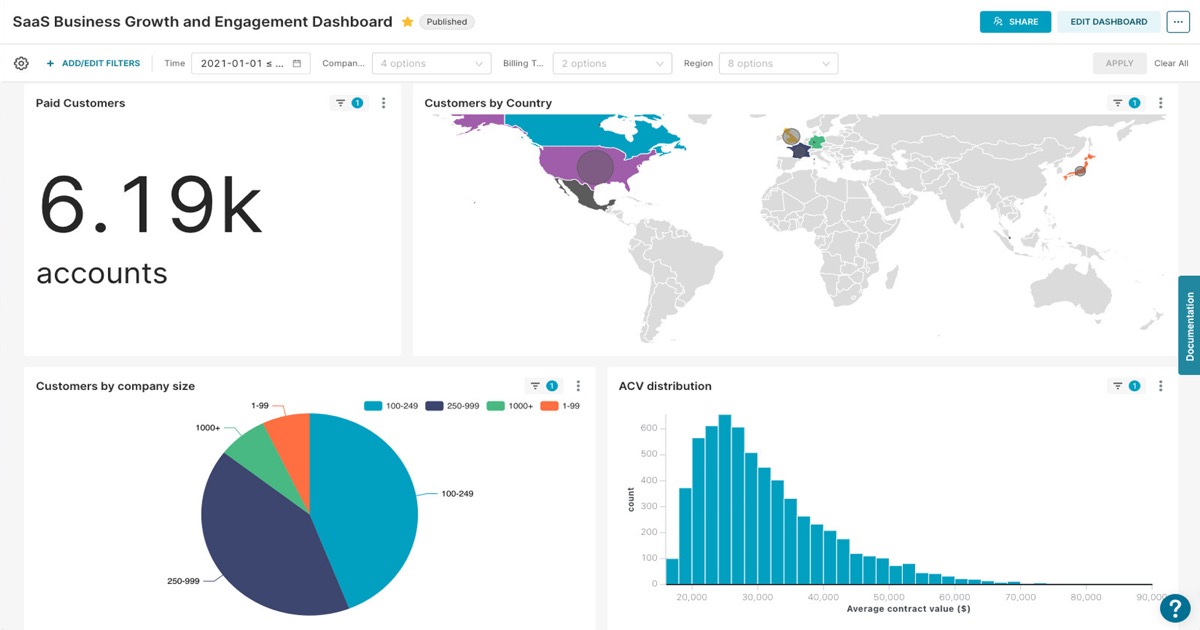
Welcome | Superset
Community website for Apache Superset™, a data visualization and data exploration platform
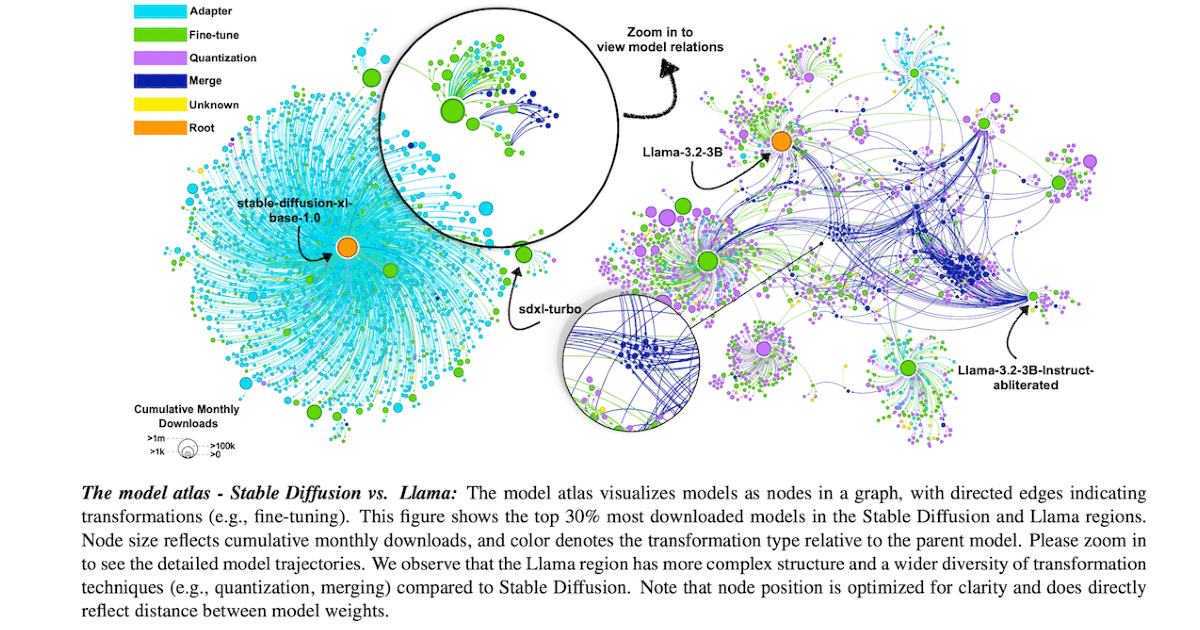
Charting and Navigating Hugging Face's Model Atlas
Charting and Navigating Hugging Face's Model Atlas: an interactive visualization and analysis tool for exploring large-scale AI model repositories. The atlas maps model relationships, and helps identify trends and fill in undocumented regions using structural patterns in the data.
mlx-examples/stable_diffusion at main · ml-explore/mlx-examples
Examples in the MLX framework. Contribute to ml-explore/mlx-examples development by creating an account on GitHub.