
Explained Visually (EV) is an experiment in making hard ideas intuitive inspired the work of Bret Victor's Explorable Explanations. Sign up to hear about the latest.
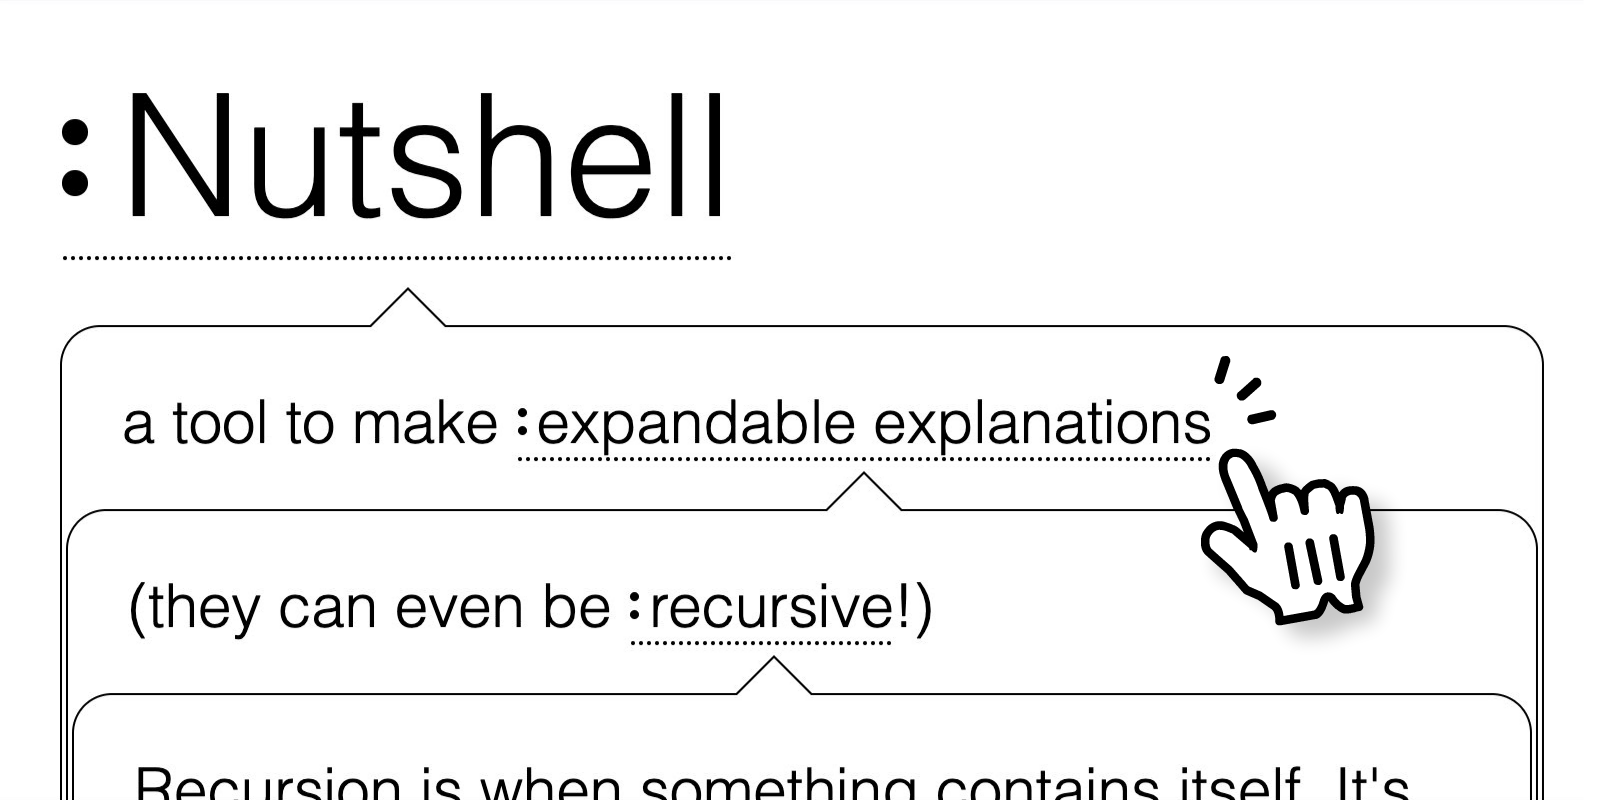
Nutshell: make expandable, embeddable explanations
a tool to let your readers dive into details
Konrad Hinsen's blog
A much cited essay by Bret Victor, "Explorable Explanations", argues for supporting and encouraging active reading in communicating ideas. Explanatory text should thus be complemented by interactive visualizations and computational demonstrations, allowing the reader to actively engage with the ideas. If you haven't read Victor's essay yet, please do so now, and then come back here. It's not very long. What I am going to discuss is a variation on Victor's proposal, and I won't repeat his well-presented arguments.
ELI5 : What exactly is Aesthetic Visual Analysis?
I am a designer and I recently read about Netflix using an image discovery tool called AVA to generate frames from the content on their platform…
What does "Intuitive" actually mean?
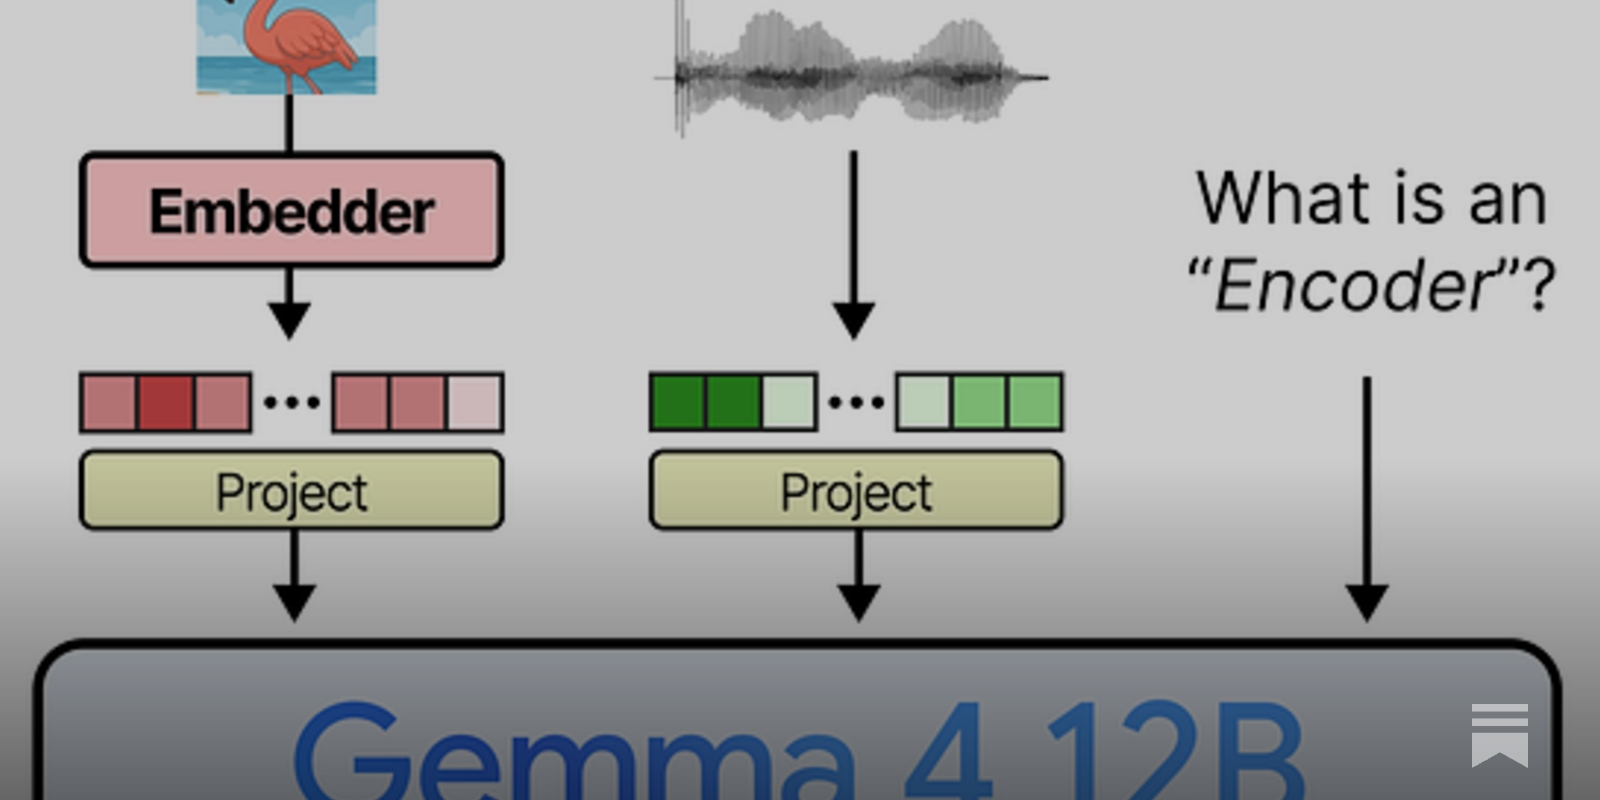
A Visual Guide to Gemma 4 12B
An in-depth explainer to Gemma 4 12B; a unified, encoder-free multimodal model!
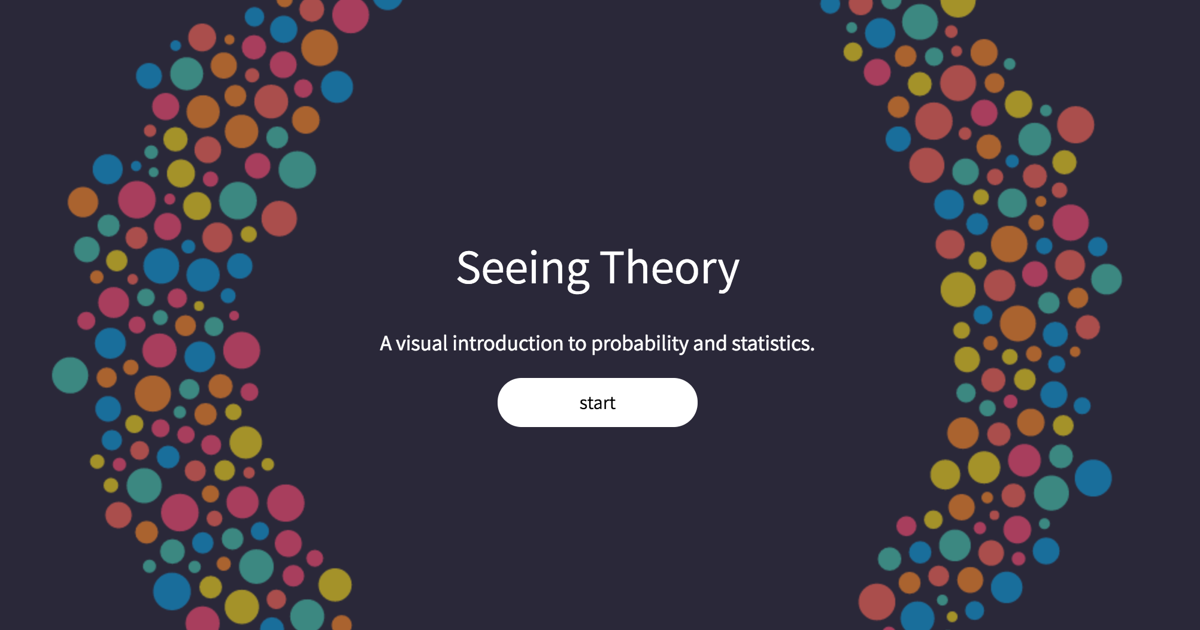
A High-Level Grammar of Interactive Graphics
Vega-Lite - a high-level grammar for statistical graphics. Vega-Lite provides a higher-level grammar for visual analysis, comparable to ggplot or Tableau, that generates complete Vega specifications. Vega-Lite specifications consist of simple mappings of variables in a data set to visual encoding channels such as x, y, color, and size. These mappings are then translated into detailed visualization specifications in the form of Vega specification language. Vega-Lite produces default values for visualization components (e.g., scales, axes, and legends) in the output Vega specification using a rule-based approach, but users can explicit specify these properties to override default values.
Notes on Gamma
The nuance between seeing and perceiving, linearity and non-linearity, what EOTFs are – and how to draw nice smooth gradients against the odds

A Visualization Grammar
Vega - A Visualization Grammar. Vega is a visualization grammar, a declarative format for creating, saving, and sharing interactive visualization designs. With Vega, you can describe the visual appearance and interactive behavior of a visualization in a JSON format, and generate web-based views using Canvas or SVG.

Visually stunning math concepts which are easy to explain
Since I'm not that good at (as I like to call it) 'die-hard-mathematics', I've always liked concepts like the golden ratio or the dragon curve, which are easy to understand and explain but are

Visual Variables
Visual variables are “the differences in map elements as perceived by the human eye” (wiki.gis.com). No matter what the type of map, these are the fundamental ways in which graphic symbols can be distinguished.
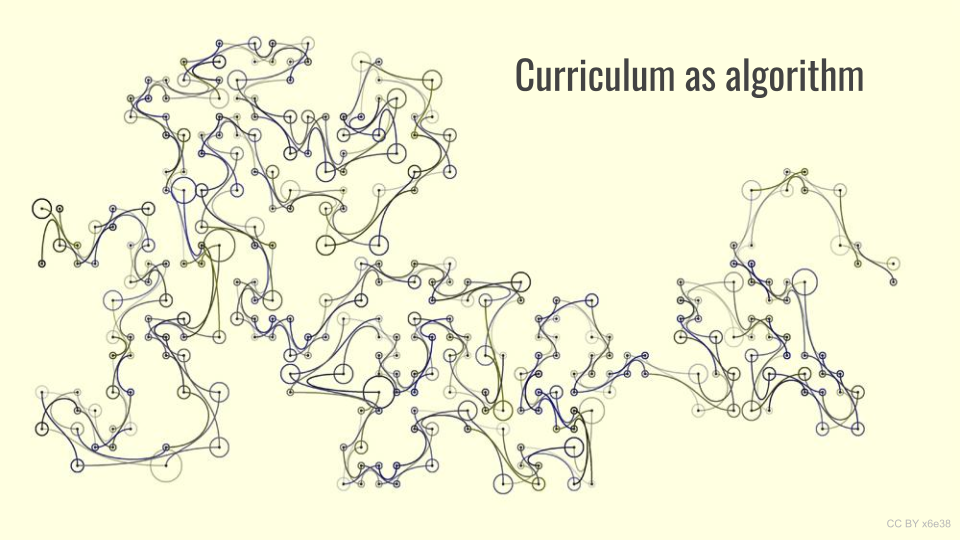
Curriculum as algorithm. Curriculum as heuristic.
If you've ever seen me present on digital literacies or digital credentials, you've probably seen me use the above slide in passing. I use it to explain that ev…