

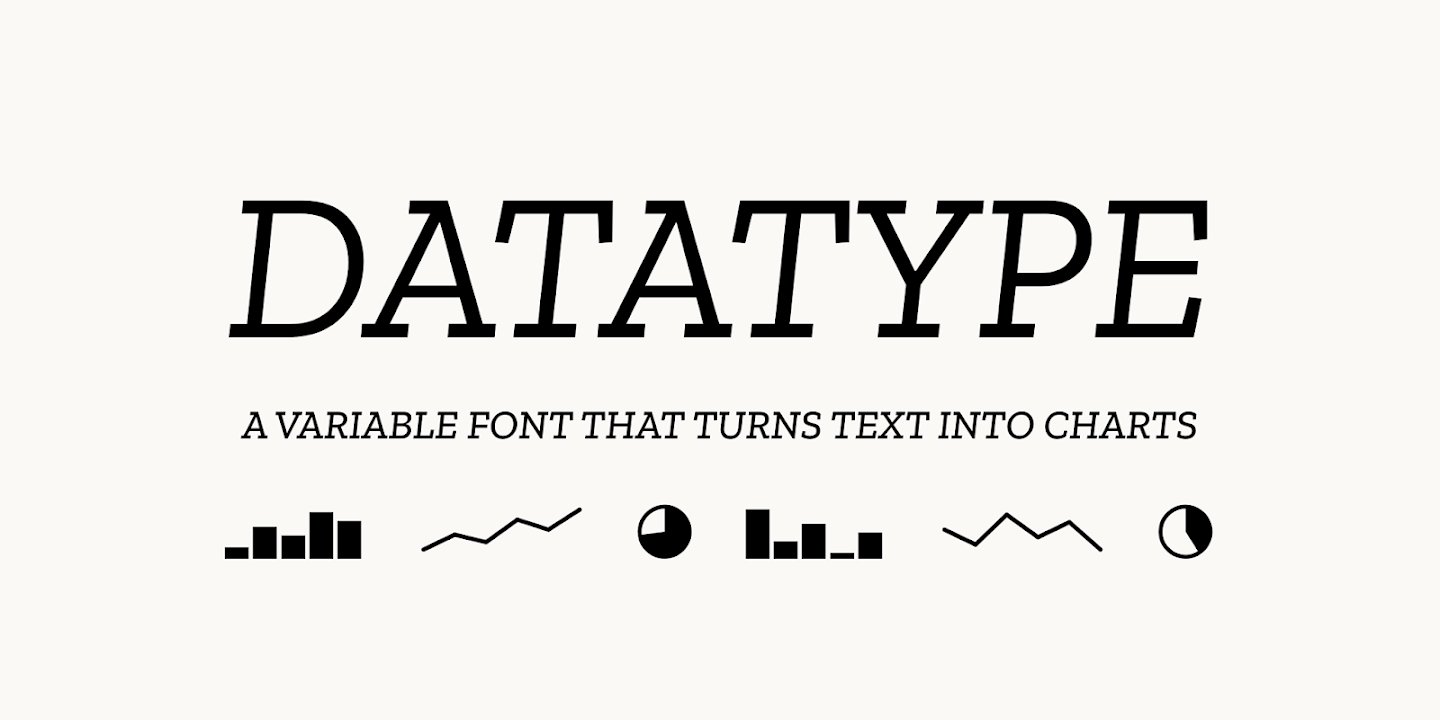
Meet Datatype, my new font that turns text into charts. Available on Google Fonts and of course in Workspace.Simple syntax like {b:10,25,7,95} turns into sparklines, pie charts, and bar charts that look great in your docs, slides, and sheets.https://t.co/0cgEkOcFfM pic.twitter.com/wViF3fPtMr— Frank Tisellano (@franktisellano) March 12, 2026
Datatype — variable font that turns text into charts
An OpenType variable font that turns simple text expressions into inline charts. No JavaScript, no images — just type.
Chart Design Principles | Hands-On Data Visualization
Tell your story and show it with data, using free and easy-to-learn tools on the web. This introductory book teaches you how to design interactive charts and customized maps for your website, beginning with easy drag-and-drop tools, such as Google Sheets, Datawrapper, and Tableau Public. You will also gradually learn how to edit open-source code templates built with Chart.js, Highcharts, and Leaflet on GitHub. Follow along with the step-by-step tutorials, real-world examples, and online resources. This book is ideal for students, non-profit organizations, small business owners, local governments, journalists, academics, or anyone who wants to tell their story and show the data. No coding experience is required.
On power, aesthetics, materiality and change in data visualization
Notes from the Information+ Conference at MIT/Northeastern University, Boston.
TanStack Charts
A typed, tree-shakable chart grammar for SVG and Canvas. Compose marks, views, scales, transforms, interactions, and motion with compact primitives or D3-compatible inputs.
Font with Built-In Syntax Highlighting
An experiment in javascript-free syntax highlighting, made possible by opentype contextual alternates and COLR table

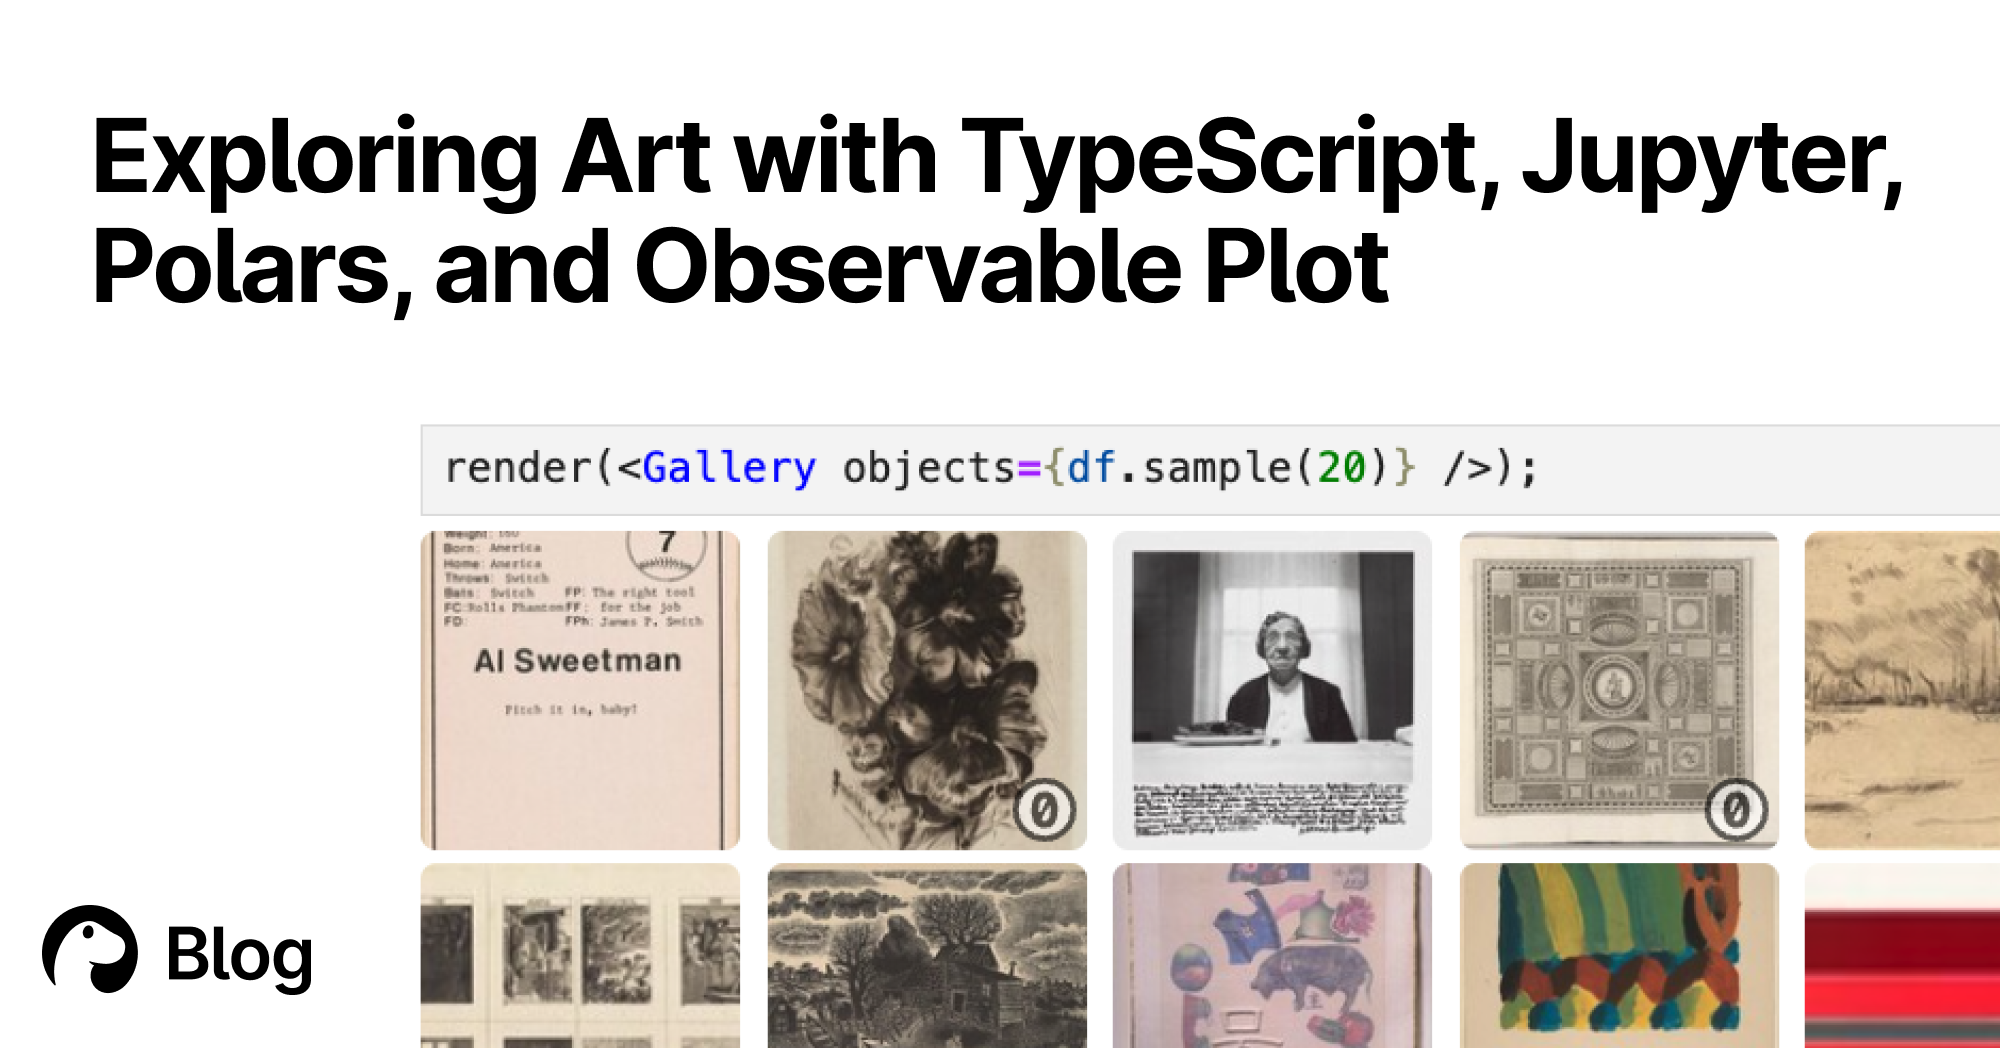
Exploring Art with TypeScript, Jupyter, Polars, and Observable Plot | Deno
With Deno's Jupyter support, you can explore, interact, and create interactive charts with TypeScript and HTML. Here's a tutorial featuring data of over 130,000 famous artworks.
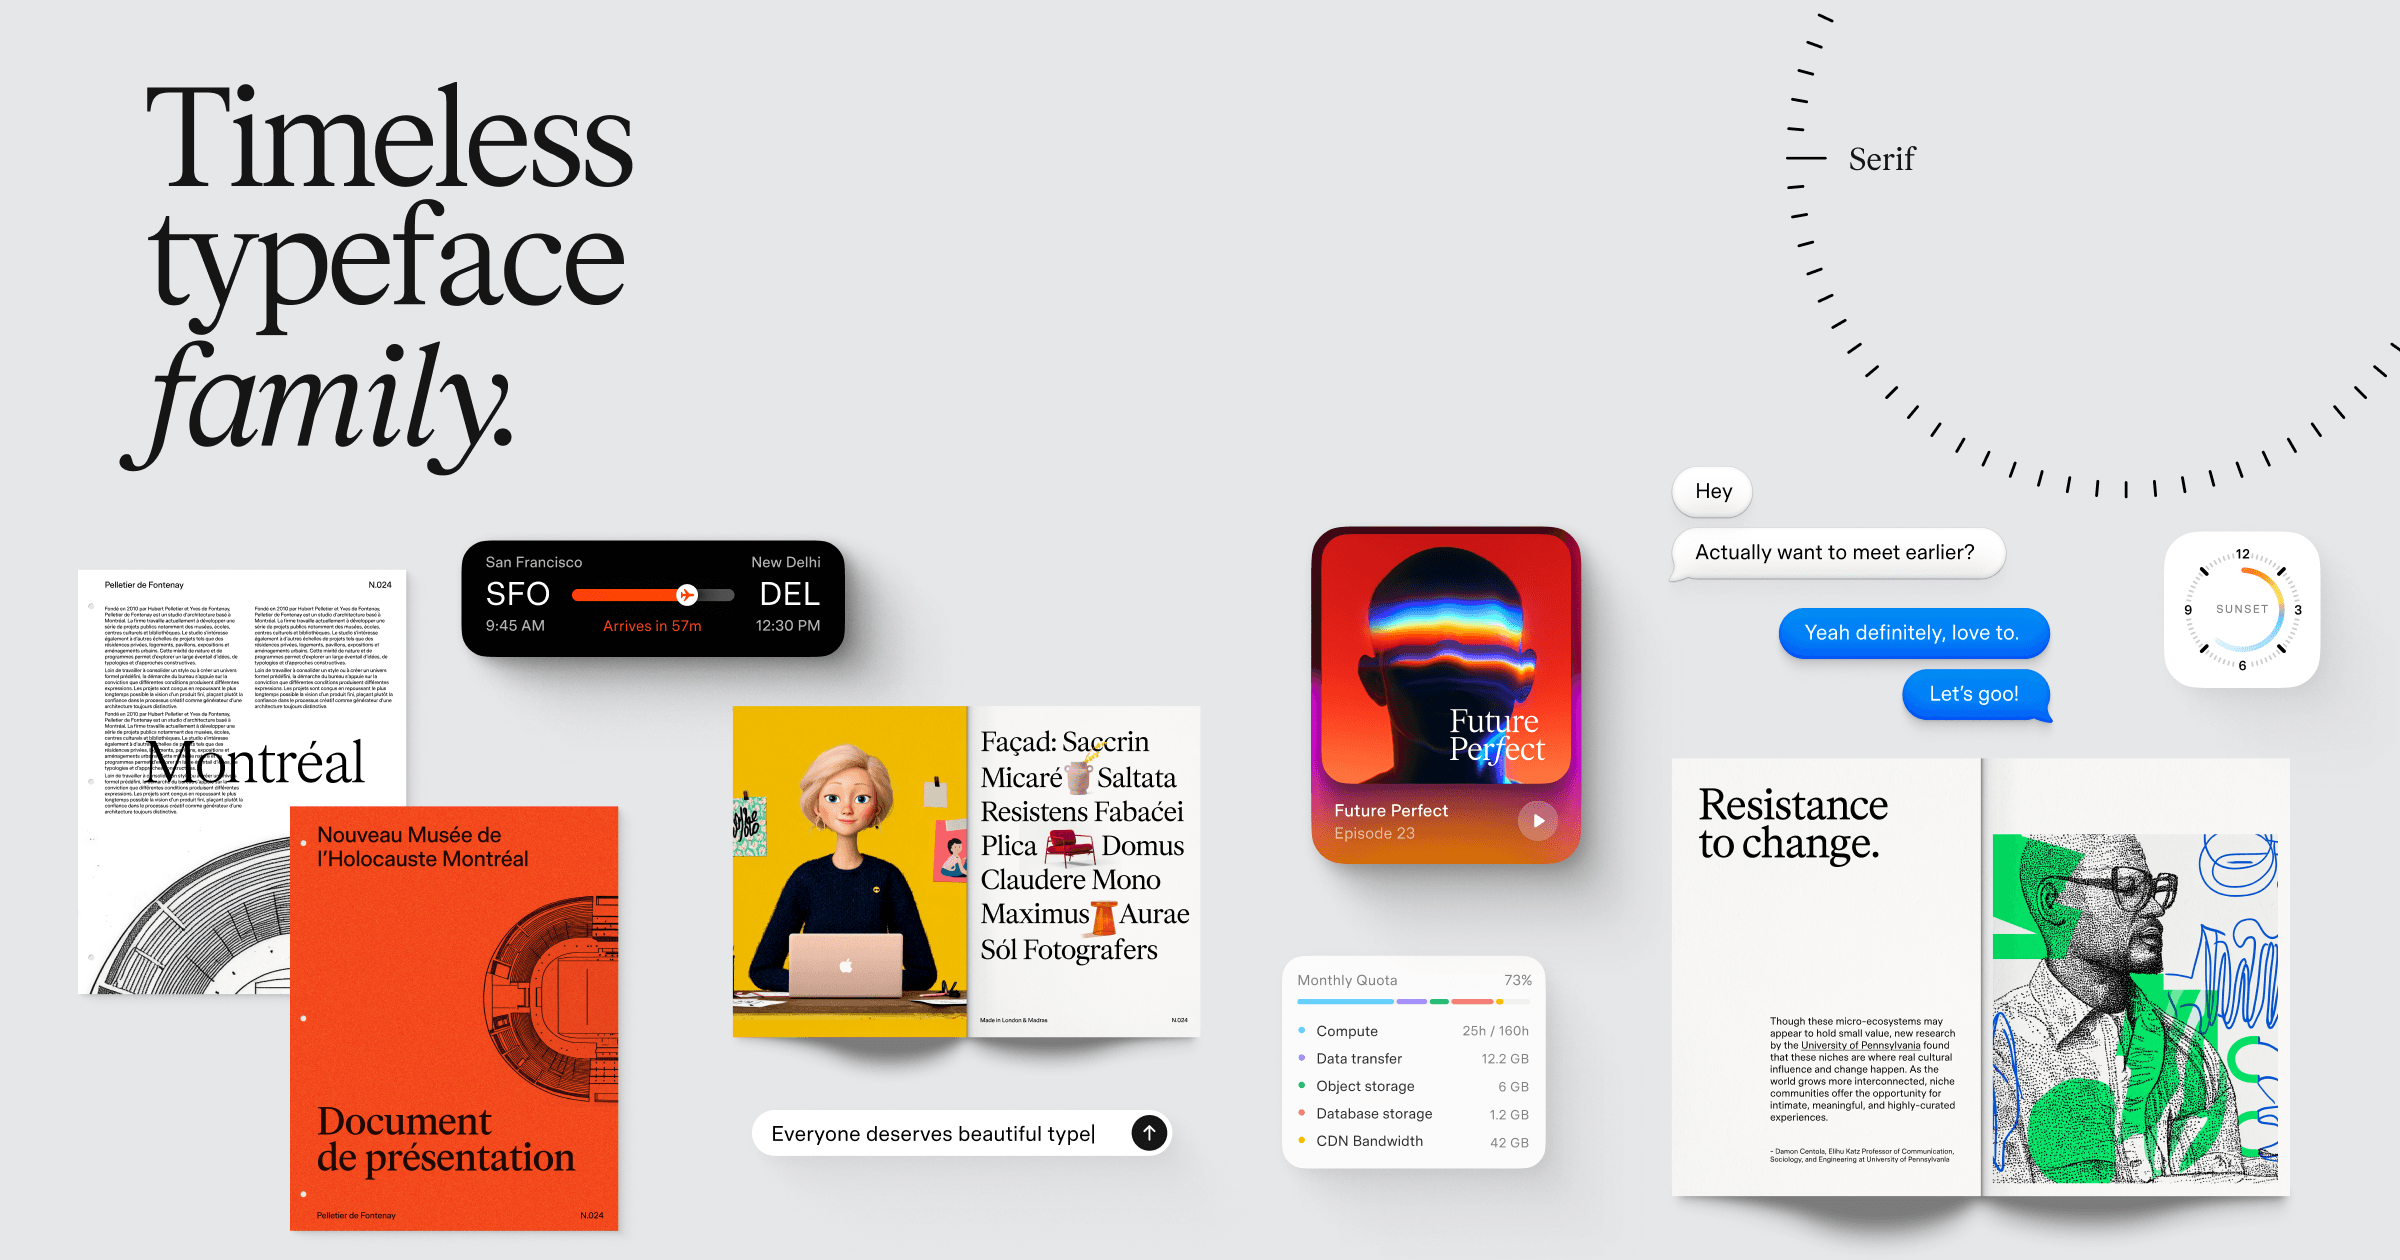
Timeless Type Family
Timeless Grotesk, Sans, Serif and Text — four variable typefaces with matching italics, free for personal and commercial use.
Generating 3D Meshes From Text
I recently had a desire to convert text to 3D meshes that I could render and manipulate as part of my Geotoy project and Geoscript language. I did some research into tools and libraries that could solve different pieces of this, and I put together a pipeline that implements the whole thing - yielding nice, 2-manifold 3D meshes with arbitrary fonts, text styles, and more.

chartgerink - Overview
chartgerink has 41 repositories available. Follow their code on GitHub.

Stop settling for overused fonts
Visual font discovery for designers. Explore fonts by similarity, vibe, use case, and popularity.
Fonts In Use
A searchable archive of typographic design, indexed by typeface, format, and topic.
Euphony: Visualize Chat Data in Your Browser
Really cool idea 🤯 - Install this web font - Just add plain text to the DOM - It renders a chart using font ligatures No JS, no hydration FOUC franktisellano.github.io/datatype/
"Jelly text (Variable Font Physics)" by mike-at-redspace codepen.io/mike-at-redspace/pen/JoRPvpy (Feels like you could recreate some of the great design at follow.art with variable fonts!)

