

BonitoBook excels in plotting, customizability, ai integration and language interoperability, making it perfect for exploring data, building dashboards and any other interactive application.
Introducing Storybook Loop
Free cloud collaboration tool for UI components and libraries


Building a spreadsheet from the ground up | Prabhanshu Gupta
Nicolas Poulain Capytale: a case of large scale use of jupyter notebooks in education | JupyterCon
Project Jupyter
The Jupyter Notebook is a web-based interactive computing platform. The notebook combines live code, equations, narrative text, visualizations, interactive dashboards and other media.

Introducing notebook.link: The Future of Notebook Sharing
Reimagining how you share, collaborate, and run Jupyter notebooks — all in your browser.

Open-sourcing Keyhive, filtering Ambsheets, and Sketchpad explorations
Some updates from our ongoing work on local-first auth, a new post from our Ambsheets project about filtering scenarios in a spreadsheet, and some explorations of the historic Sketchpad project for constraint-based drawing.
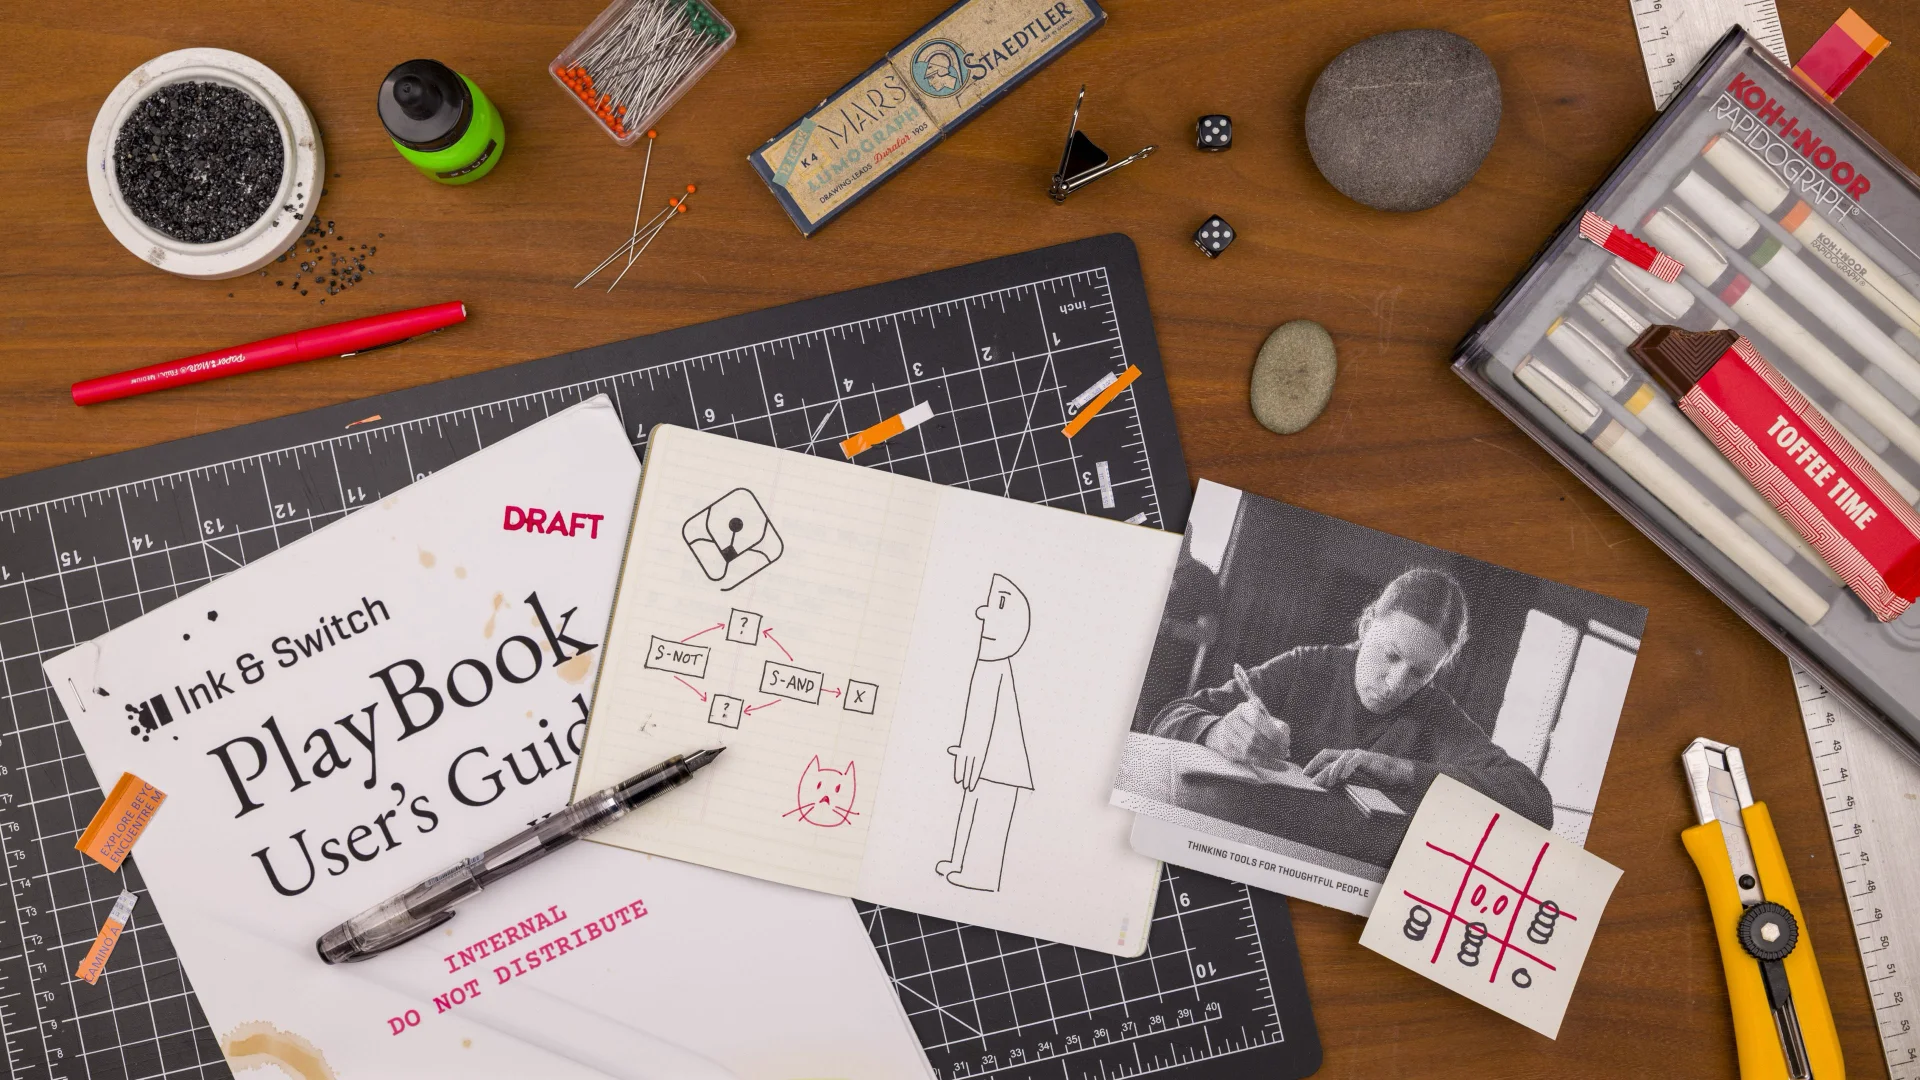
Issue 084: Spreadsheets
Welcome to the 84th issue of De Programmatica Ipsum, about Spreadsheets. In this edition, we declare spreadsheets the most popular software programming environment of all time; in the Library section, we learn how to use Lotus 1-2-3 for science reading "Spreadsheet Physics" by Charles Misner and Patrick Cooney; and in our Vidéothèque section, we discover that Excel is a Turing-complete, functional programming language through the eyes of Dr. Felienne Hermans.

Observable Canvases | Explore and visualize data together
Observable’s collaborative data canvas helps you explore data, perform analysis, and build expressive charts and dashboards.
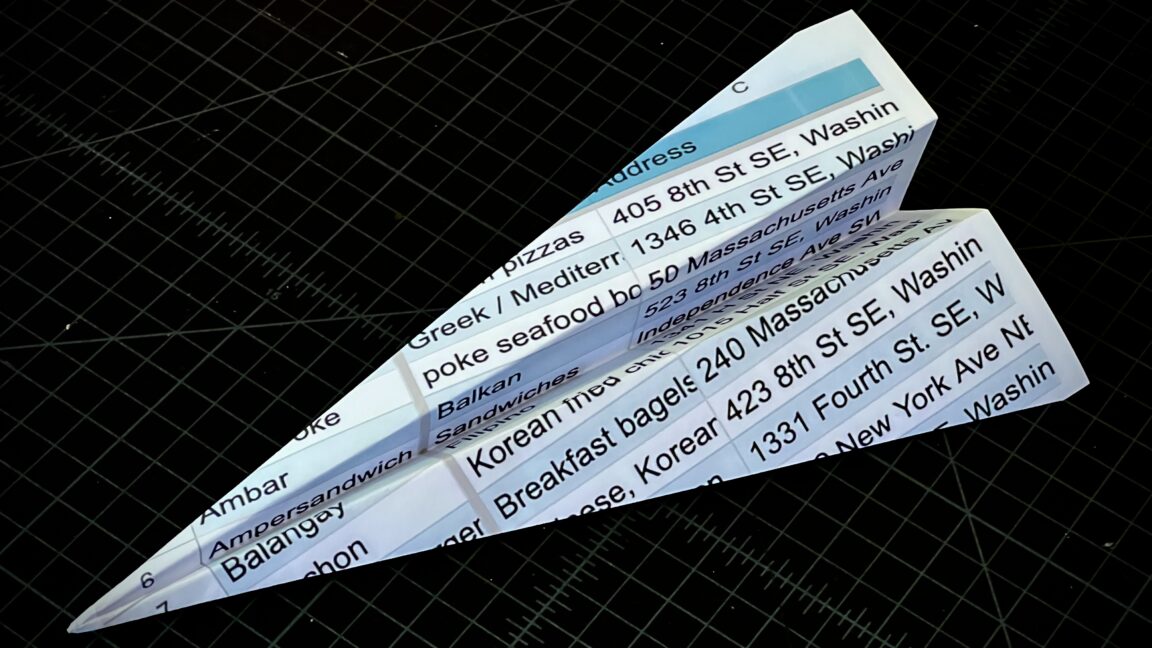
I keep turning my Google Sheets into phone-friendly webapps, and I can’t stop
How I tackled takeout, spices, and meal ideas with spreadsheets and Glide.
Welcome to Makie! | Makie
Create impressive data visualizations with Makie, the plotting ecosystem for the Julia language. Build aesthetic plots with beautiful customizable themes, control every last detail of publication quality vector graphics, assemble complex layouts and quickly prototype interactive applications to explore your data live.
Keynote: Bridging Gaps with Code: Transforming K12 Education with Jupyter Everywhere - I. Martinez
Chart Design Principles | Hands-On Data Visualization
Tell your story and show it with data, using free and easy-to-learn tools on the web. This introductory book teaches you how to design interactive charts and customized maps for your website, beginning with easy drag-and-drop tools, such as Google Sheets, Datawrapper, and Tableau Public. You will also gradually learn how to edit open-source code templates built with Chart.js, Highcharts, and Leaflet on GitHub. Follow along with the step-by-step tutorials, real-world examples, and online resources. This book is ideal for students, non-profit organizations, small business owners, local governments, journalists, academics, or anyone who wants to tell their story and show the data. No coding experience is required.