

visualizing the surface-area growth rate of the web platform based on Browser Compat Data (BCD) data set from @openwebdocs.org. not be 100% correct yet, but the gist is right. need to clean it up then will post the source generator + data.
Feb 19, 2025 at 6:22 PM
Peak Web Has Passed | datagubbe.se
zio.sh/didweb.watch
🦋🤖 Bluesky bot to track did:web usage — https://bsky.app/profile/didweb.watch
Web bloat isn’t a knowledge problem | Christian Heilmann
There is a consensus among all browser makers and lovers of the web: the current state of the web is a mess. The average web page is 2.4 megabyte big and has over 200 requests.
cssEarth: the universe in HTML and CSS
Explore planets, moons, stars and galaxies built from open space data as 3D HTML and CSS, without WebGL or canvas.

Google+ | web.dev
We hit our goal of never downloading more than 60k of HTML, 60k of JavaScript and 60k of CSS at any one time!

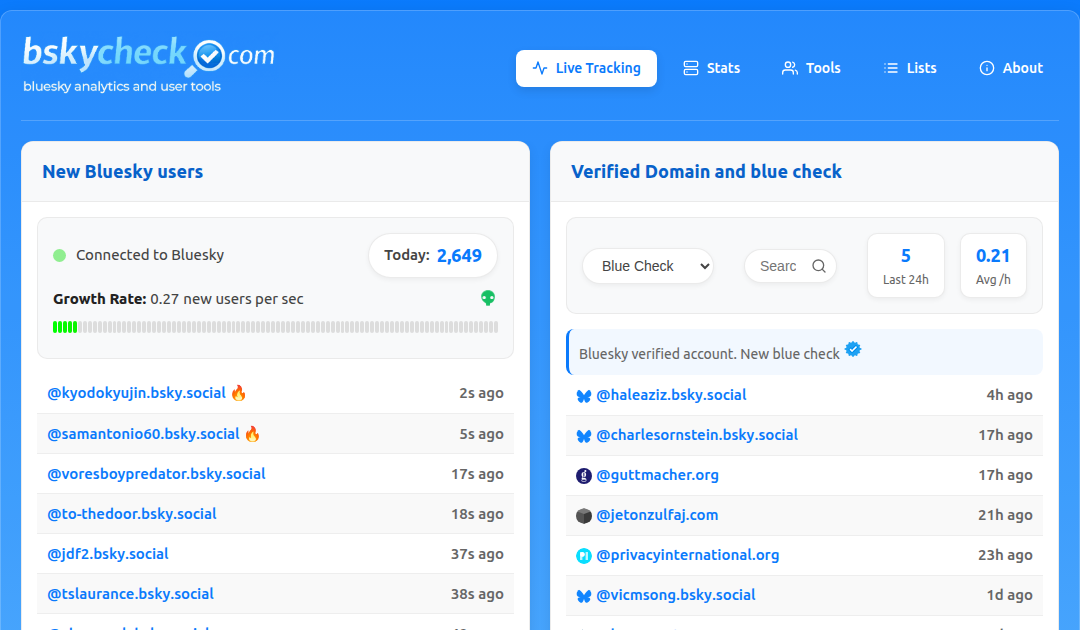
BSkyCheck - Real-Time Bluesky Analytics & User Tools
Track Bluesky growth as it happens with our real-time dashboard. See live user sign-ups, monitor current growth rate, and explore verified domain handles across government, education, commercial and other categories.
All The Places
A growing set of web scrapers designed to output consistent geodata about as many places of business in the world as possible.
GoogleChromeLabs/wpt-gen
A CLI tool to analyze feature specs and generate the required web platform tests
Statcounter Global Stats - Browser, OS, Search Engine including Mobile Usage Share
Tracks the Usage Share of Search Engines, Browsers and Operating Systems including Mobile from over 3 billion monthly page views.

The web is Doom - mobiForge
In July 2015, inspired by something Mat Marquis said at TXJS 2015, I suggested that the average web page weight would equal that of the Doom install image in about 7 months time. In about 7 months average web page size will be same as Doom install image. Well done us! Onwards & upwards! pic.twitter.com/xtSAtZjPGl

The Day I Logged 1 In Every 2000 Public IPv4: Visualizing The AI Scraper DDoS - VulpineCitrus
In an attempt to grasp the magnitude of web scraper attacks against my websites, i went the way of visualizing.

WDC - RDFa, Microdata, and Microformat Data Sets
More and more websites have started to embed structured data describing products, people, organizations, places, and events into their HTML pages using markup standards such as Microdata, JSON-LD, RDFa, and Microformats. The Web Data Commons project extracts this data from several billion web pages. So far the project provides 12 different data set releases extracted from the Common Crawls 2010 to 2023. The project provides the extracted data for download and publishes statistics about the deployment of the different formats.
Tried a different approach this time. Explore your repo, user, and post analytics with a screenshot tool for detailed data capture and more. Feedback welcome. #ATProto #BlueskyProjects romiojoseph.github.io/atproto-explorer/

AT Proto Explorer and Bluesky Insights
romiojoseph.github.io
