The 34th International Symposium on Graph Drawing and Network Visualization
The 34th International Symposium on Graph Drawing and Network Visualization will be held at Brock University in St. Catharines, Ontario, Canada from August 17-21, 2026. A PhD school will take place on August 17-18, 2026.
Security-first diagramming for teams | draw.io
Free, open source diagramming application with 100M+ users. Store your data wherever you want—we can't access it.
A conceptual model of ATProto and ActivityPub
If you were to design an open social networking protocol, what would that look like? Which metaphors and comparisons would you use to get a general idea of how the network functions? And what would you answer if people ask if your network is decentralised and federated?

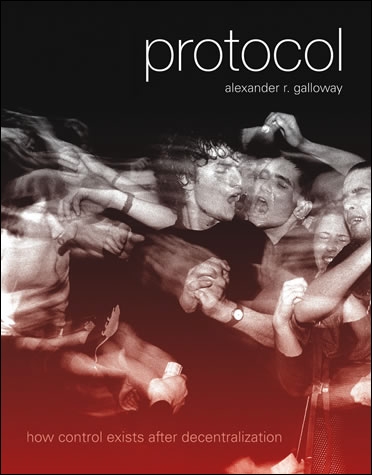
Protocol: How Control Exists after Decentralization by …
How Control Exists after Decentralization by Galloway, …

Protocol: How Control Exists after Decentralization
How Control Exists after DecentralizationIs the Internet a vast arena of unrestricted communication and freely exchanged information or a regulated, highly
Hive Plots - Linear Layout for Network Visualization - Visually Interpreting Network Structure and Content Made Possible
the hive plot is a perceptually uniform and scalable linear layout visualization for network visual analytics
AI, Agency and Protocols_ Power and Governance in Open Social Networks.pdf
Agent Economies | Interactive AI Network Visualization
Explore the future of AI agent economies through an interactive network visualization representing autonomous systems that collaborate and evolve.
Paradigm shifts for the decentralized Web
The answer to these questions varies with different degrees of decentralization:
a practical guide to decentralization (for my friends) - tim's tinkerings
Brad's Thoughts on the Social Graph
I've been thinking a lot about the social graph for awhile now: aggregating the graph, decentralization, social network portability, etc.
Cloud Atlas
Interactive map of the Bluesky social graph, initially compiled by https://theo.io, turbocharged with goose powers.

On power, aesthetics, materiality and change in data visualization
Notes from the Information+ Conference at MIT/Northeastern University, Boston.
The Together Project
What if we could actually see the acknowledgement graph that connects humans and communities in a hidden economic web?

Knowledge Networks and the Politics of Protocols
Harmony without loss of Variety; Variety without loss of Harmony.