

Really cool idea 🤯 - Install this web font - Just add plain text to the DOM - It renders a chart using font ligatures No JS, no hydration FOUC franktisellano.github.io/datatype/
May 6, 2026 at 7:09 AM
Meet Datatype, my new font that turns text into charts. Available on Google Fonts and of course in Workspace. Simple syntax like {b:10,25,7,95} turns into sparklines, pie charts, and bar charts that look great in your docs, slides, and sheets. https://t.co/0cgEkOcFfM https://t.co/wViF3fPtMr
Meet Datatype, my new font that turns text into charts. Available on Google Fonts and of course in Workspace.Simple syntax like {b:10,25,7,95} turns into sparklines, pie charts, and bar charts that look great in your docs, slides, and sheets.https://t.co/0cgEkOcFfM pic.twitter.com/wViF3fPtMr— Frank Tisellano (@franktisellano) March 12, 2026
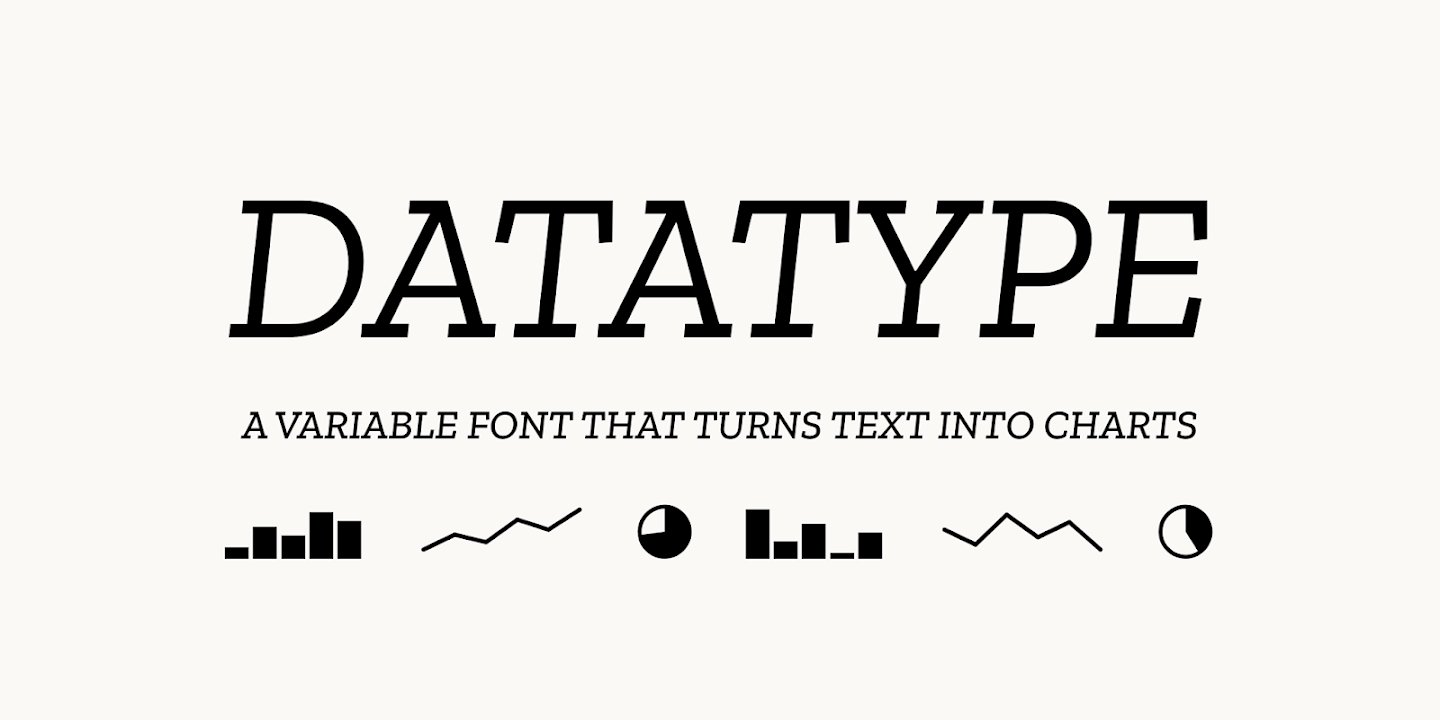
Datatype — variable font that turns text into charts
An OpenType variable font that turns simple text expressions into inline charts. No JavaScript, no images — just type.
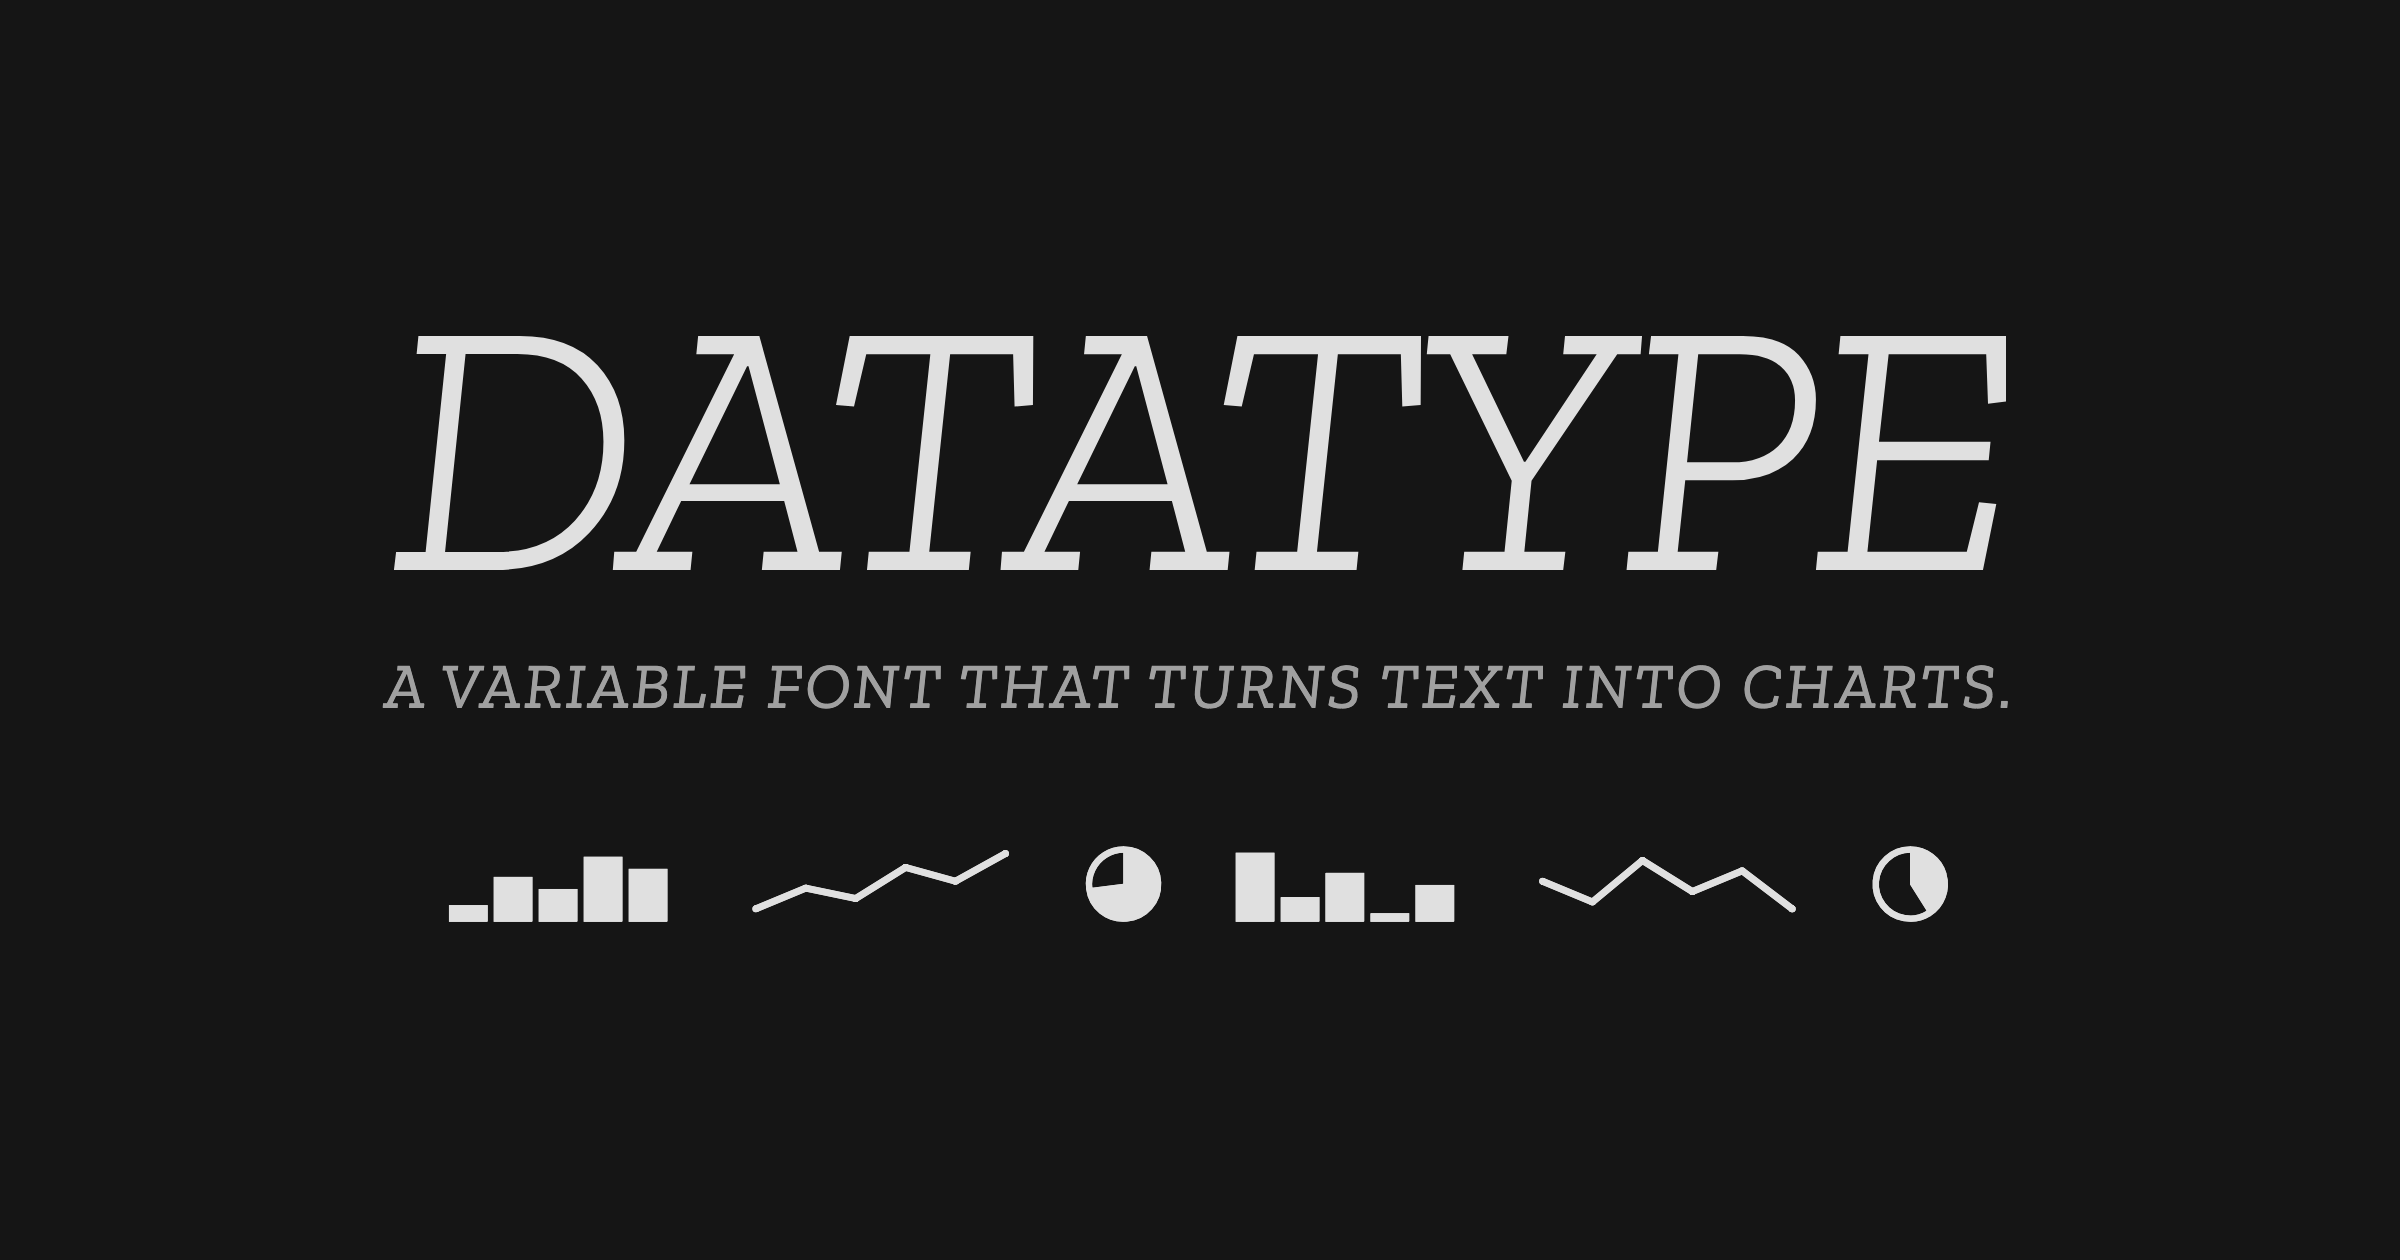
Chart Design Principles | Hands-On Data Visualization
Tell your story and show it with data, using free and easy-to-learn tools on the web. This introductory book teaches you how to design interactive charts and customized maps for your website, beginning with easy drag-and-drop tools, such as Google Sheets, Datawrapper, and Tableau Public. You will also gradually learn how to edit open-source code templates built with Chart.js, Highcharts, and Leaflet on GitHub. Follow along with the step-by-step tutorials, real-world examples, and online resources. This book is ideal for students, non-profit organizations, small business owners, local governments, journalists, academics, or anyone who wants to tell their story and show the data. No coding experience is required.
Font with Built-In Syntax Highlighting
An experiment in javascript-free syntax highlighting, made possible by opentype contextual alternates and COLR table

Euphony: Visualize Chat Data in Your Browser
JSON Crack - Chrome Web Store
Visualize JSON pages as an interactive graph. Toggle between raw text and an auto-generated diagram.

HTML Can Do That
HTML has been gobbling up swathes of what used to be JavaScript’s remit. This page lists a bunch of dynamic functionality that we can now achieve with just HTML.

HTML Can Do That
HTML has been gobbling up swathes of what used to be JavaScript’s remit. This page lists a bunch of dynamic functionality that we can now achieve with just HTML.

Sigma.js
a JavaScript library aimed at visualizing graphs of thousands of nodes and edges
Cloudflare Fonts: enhancing website font privacy and speed
Introducing Cloudflare Fonts. Enhance privacy and performance for websites using Google Fonts by loading fonts from their own origin. Improve user privacy, enhance site performance, and simplify the process. No need for code changes. Simply enable Cloudflare Fonts in your dashboard.
Incremental Font Transfer Demo
This demonstrates the use of the incremental font transfer (IFT) to load font data for display of a variety of scripts. IFT works by using patches to extend a font to cover more codepoints and/or axes as they are encountered in rendered text. This allows loading of only the parts of a font that are actually needed. This demo is using a fully static (ie. no dynamic backend) version of IFT. IFT is currently in development with the w3c webfonts working group and an early draft of the specification implemented by this demo can be found here.
SvelteKit & TailwindCSS Tutorial – Build & Deploy a Web Portfolio
kepano (@stephango.com)
This is Pele, my new rendering library for diagrams and charts, compatible with the latest Mermaid syntax. - 100-500× faster than mermaid.js - 6× smaller bundle - No dependencies - Easy to theme - Responsive to device width - Open source (MIT) Try it at pele.run

