

Texas History Timeline | Bullock Texas State History Museum
The Story of Texas is a long one. Did you know that Texas people have been living in Texas since 14,000 BCE? Explore with the Texas history timeline.

Texas History Lessons
Texas History Lessons is a podcast about Texas history and much more. History is an important area of study and it is fun. While most of the focus will, of course, …

Data Visualization with JavaScript
It’s getting hard to ignore the importance of data in our lives. Data is critical to the largest social organizations in human history. It can affect even the least consequential of our everyday decisions. And its collection has widespread geopolitical implications. Yet it also seems to be getting easier to ignore the data itself. One estimate suggests that 99.5% of the data our systems collect goes to waste. No one ever analyzes it effectively.
Home | Texas Historical Commission
Read the latest issue of our magazine to learn more about the THC's updated Washington-on-the-Brazos historic site and new cookbook.

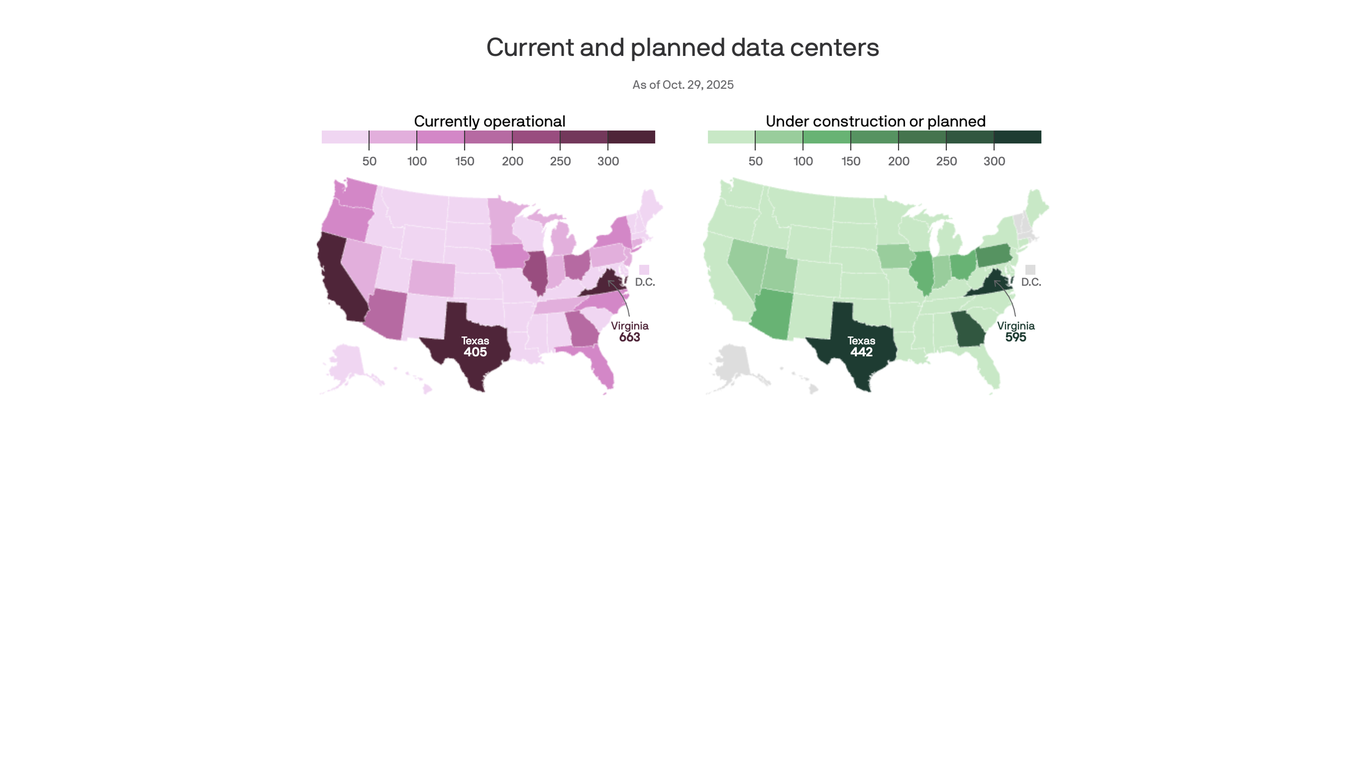
America's data center growth hot spots, mapped
Virginia and Texas lead the way, but they're becoming a major political fight.
How Democrats Swept Texas in the 2026 Elections: See Which G.O.P. Counties Flipped From 2024
Every county in Texas shifted left, voting more Democratic than two years ago when President Trump was on the ballot.

Texans Are Fighting a 6,000 Acre Nuclear-Powered Datacenter
"They're being told that this is inevitable," a member of the 806 Data Center Resistance told 404 Media. "But Texas is this other beast."

DEAR AMERICA: You Should Be Mad As Hell About This [CHARTS]
A powerful chart sparks outrage, urging Americans to take action on pressing issues affecting their lives.
Chart Design Principles | Hands-On Data Visualization
Tell your story and show it with data, using free and easy-to-learn tools on the web. This introductory book teaches you how to design interactive charts and customized maps for your website, beginning with easy drag-and-drop tools, such as Google Sheets, Datawrapper, and Tableau Public. You will also gradually learn how to edit open-source code templates built with Chart.js, Highcharts, and Leaflet on GitHub. Follow along with the step-by-step tutorials, real-world examples, and online resources. This book is ideal for students, non-profit organizations, small business owners, local governments, journalists, academics, or anyone who wants to tell their story and show the data. No coding experience is required.
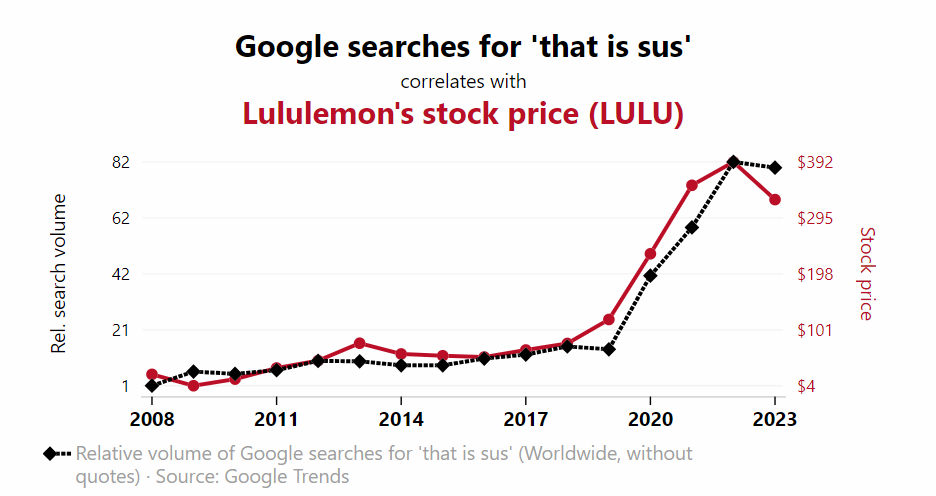
Spurious Correlations
Correlation is not causation: thousands of charts of real data showing actual correlations between ridiculous variables.
Immigration Enforcement in Los Angeles Under the Second Trump Administration – Deportation Data Project
We rely on our online visual tools to create this report, which means that you can click on any one of the figures and adjust time periods, breakouts, and other aspects to dig into the data in more detail. You can also swap out the Los Angeles ICE area of responsibility for another region to reproduce these figures for your own area of interest.
The Data-Center Debate Is Divorced From the Facts
All those scary numbers aren’t what they seem.

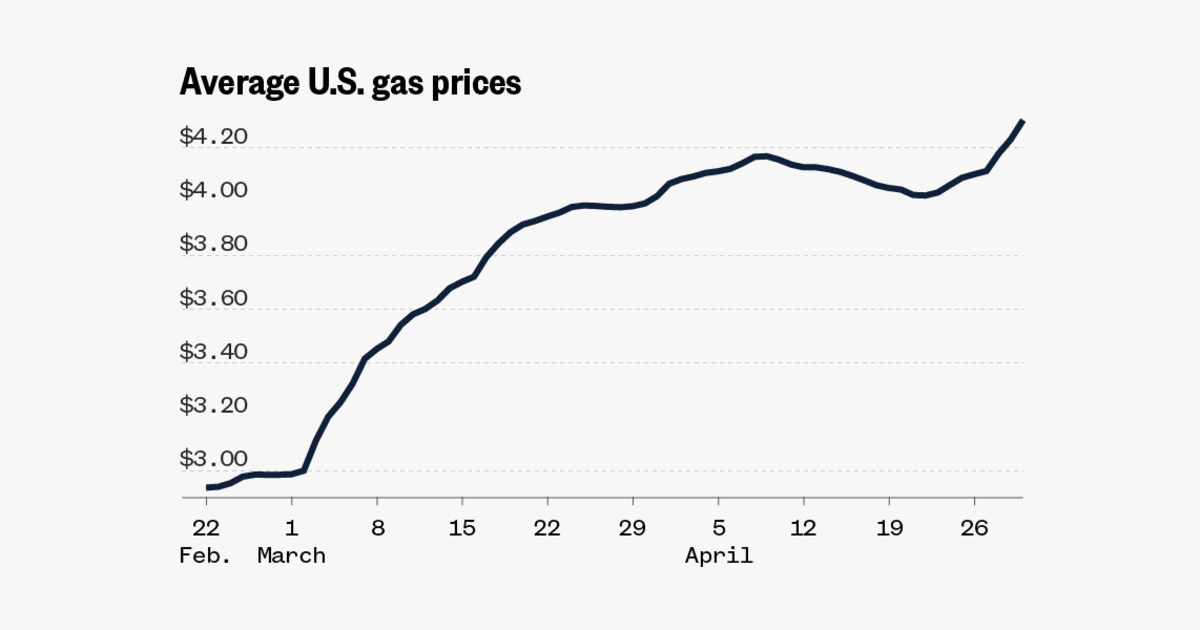
Data: Track state and national gas prices
Gas prices across the country, after declining much of April, are spiking again.

New chart on my stats page! 📊 The set of PDSes is manually selected to show those which are open and have enough users to show up at all, I will be updating it over time. I don't have historical post data to count per PDS further than a few weeks back. blue.mackuba.eu/stats/#weekly_pds_chart

