

An Award-winning Data Visualization Designer
Visual Cinnamon | Data Visualization Design & Data Art | Data made insightful, effective & beautiful through data visualization and data art
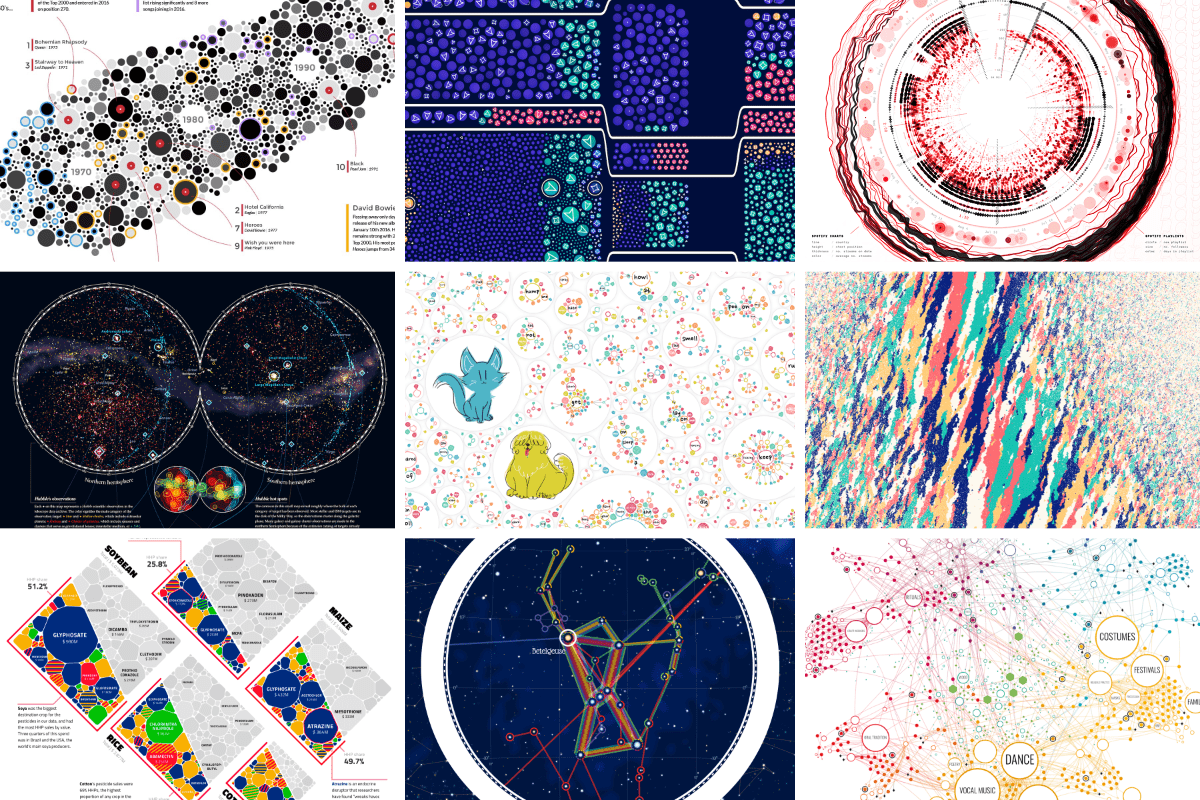
On power, aesthetics, materiality and change in data visualization
Notes from the Information+ Conference at MIT/Northeastern University, Boston.
What is data oriented design?
I was reading this article, and this guy goes on talking about how everyone can greatly benefit from mixing in data oriented design with OOP. He doesn't show any code samples, however. I googled t...

DataExpert-io/data-engineer-handbook
This is a repo with links to everything you'd ever want to learn about data engineering
Intro to Data Oriented Design for Games
RAG, Knowledge Packs and Your Notes
Ensu Packs and Your Notes help small models answer better with knowledge stored on your device.

Design system doc spec 0.15.2
A machine-readable format for design system documentation. DSDS structures components, tokens, themes, foundations, patterns, and guides as a single source of truth for humans, parsers, and agents.

Datamethods Discussion Forum
This is a place for discussions and Q&A about data-related issues and quantitative methods including study design, data analysis, and interpretation.
The poster to accompany Designing Data-Intensive Applications (DDIA)
Each chapter in Designing Data-Intensive Applications is accompanied by a map. And we’ve turned those maps into a beautiful poster.
Drawing a map of distributed data systems — Martin Kleppmann’s blog
How we created an illustrated guide to help you find your way through the data landscape.
MyData
The human-centric approach to data is aimed at a fair, sustainable, and prosperous digital society. In such a society, people get value from their data and set the agenda on how it is used. And for organisations, the ethical use of data is always the most attractive option.

Permissioned Data Diary 4: The Big Picture - Daniel's Leaflets
A special edition of the data diary that sketches out the rough shape of where we're heading.
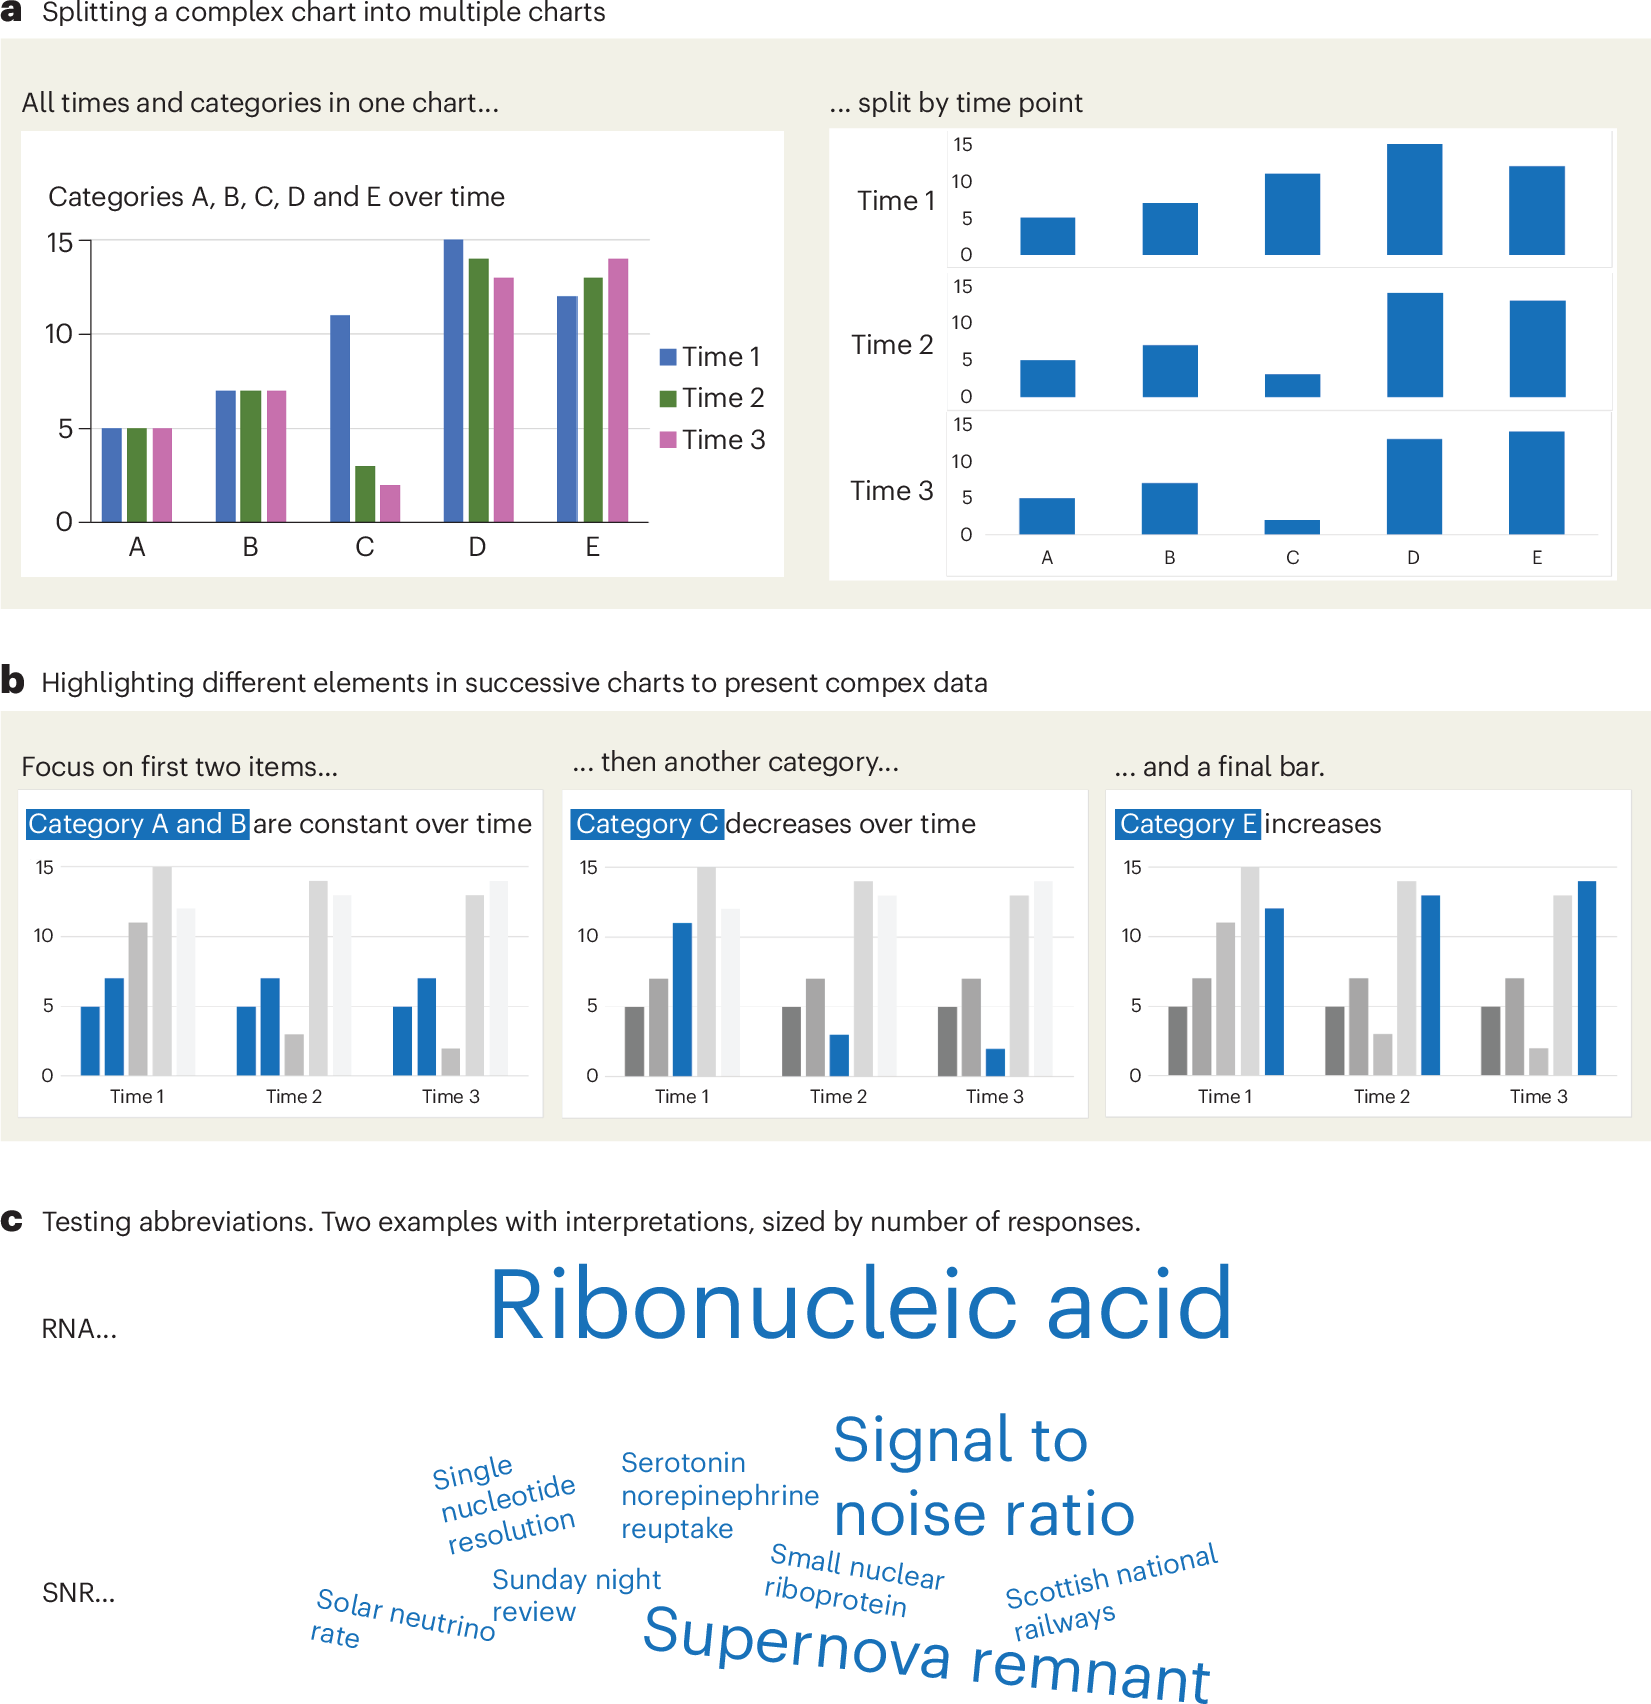
A checklist for designing and improving the visualization of scientific data
Creating clear and engaging scientific figures is crucial to communicate complex data. In this Comment, I condense principles from design, visual perception and data visualization research in a checklist that can help researchers to improve their data visualization, by focusing on clarity, accessibility and design best practices.
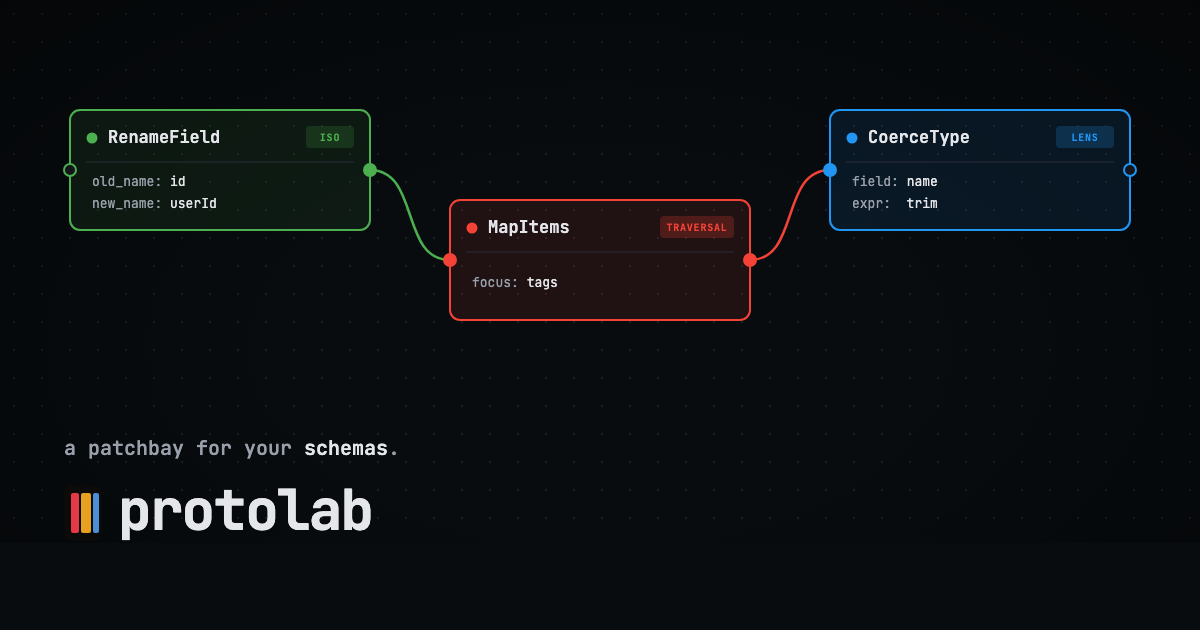
protolab
A patchbay for your schemas. Bidirectional data transformations, drawn as circuits.
here it is folks! lots of details to still nail down, but this is roughly where our heads are at for the design of a permissioned data protocol give it a read and let me know your thoughts!

Permissioned Data Diary 4: The Big Picture
dholms.leaflet.pubSvelte - Data Visualization

MIERUNE/svelte-maplibre-gl
Rich-Harris/pancake
www.npmjs.com
Unovis
Layer Cake

TanStack Table
