

real-time entity visualization powered by jetstream

Firehose Viewer — ATProto Events
Real-time ATProto event stream from the Bluesky firehose via Jetstream
GitHub - observablehq/plot: A concise API for exploratory data visualization implementing a layered grammar of graphics
A concise API for exploratory data visualization implementing a layered grammar of graphics - observablehq/plot
Linked — watch ATProto links in real time
See which records across the atmosphere point at an ATProto account, with history from Constellation and live events from Spacedust.

Spatial Canvases: Towards an Integration Domain for HCI, with Orion Reed
Spatial Canvases: Towards an Integration Domain for HCI, with Orion Reed
ATproto Command Center — Live Bluesky Firehose Dashboard
Real-time event velocity, hot collections, active accounts, and content signals — streamed from Jetstream and computed entirely in your browser.
surrealdb/surrealdb
A scalable, distributed, collaborative, document-graph database, for the realtime web
ggtime: A Grammar of Temporal Graphics
Visualizing changes over time is fundamental to learning from the past and anticipating the future. However, temporal semantics can be complicated, and existing visualization tools often struggle to accurately represent these complexities. It is common to use bespoke plot helper functions designed to produce specific graphics, due to the absence of flexible general tools that respect temporal semantics. We address this problem by proposing a grammar of temporal graphics, and an associated software implementation, 'ggtime', that encodes temporal semantics into a declarative grammar for visualizing temporal data. The grammar introduces new composable elements that support visualization across linear, cyclical, quasi-cyclical, and other granularities; standardization of irregular durations; and alignment of time points across different granularities and time zones. It is designed for interoperability with other semantic variables, allowing navigation across the space of visualizations while preserving temporal semantics.

About Coral | Coral
We believe that AI will help create a better world, but only when we explore, learn, and build it together.

GitHub - HEmile/juggl: An interactive, stylable and expandable graph view for Obsidian. Juggl is designed as an advanced 'local' graph view, where you can juggle all your thoughts with ease.
An interactive, stylable and expandable graph view for Obsidian. Juggl is designed as an advanced 'local' graph view, where you can juggle all your thoughts with ease. - GitHub - H...
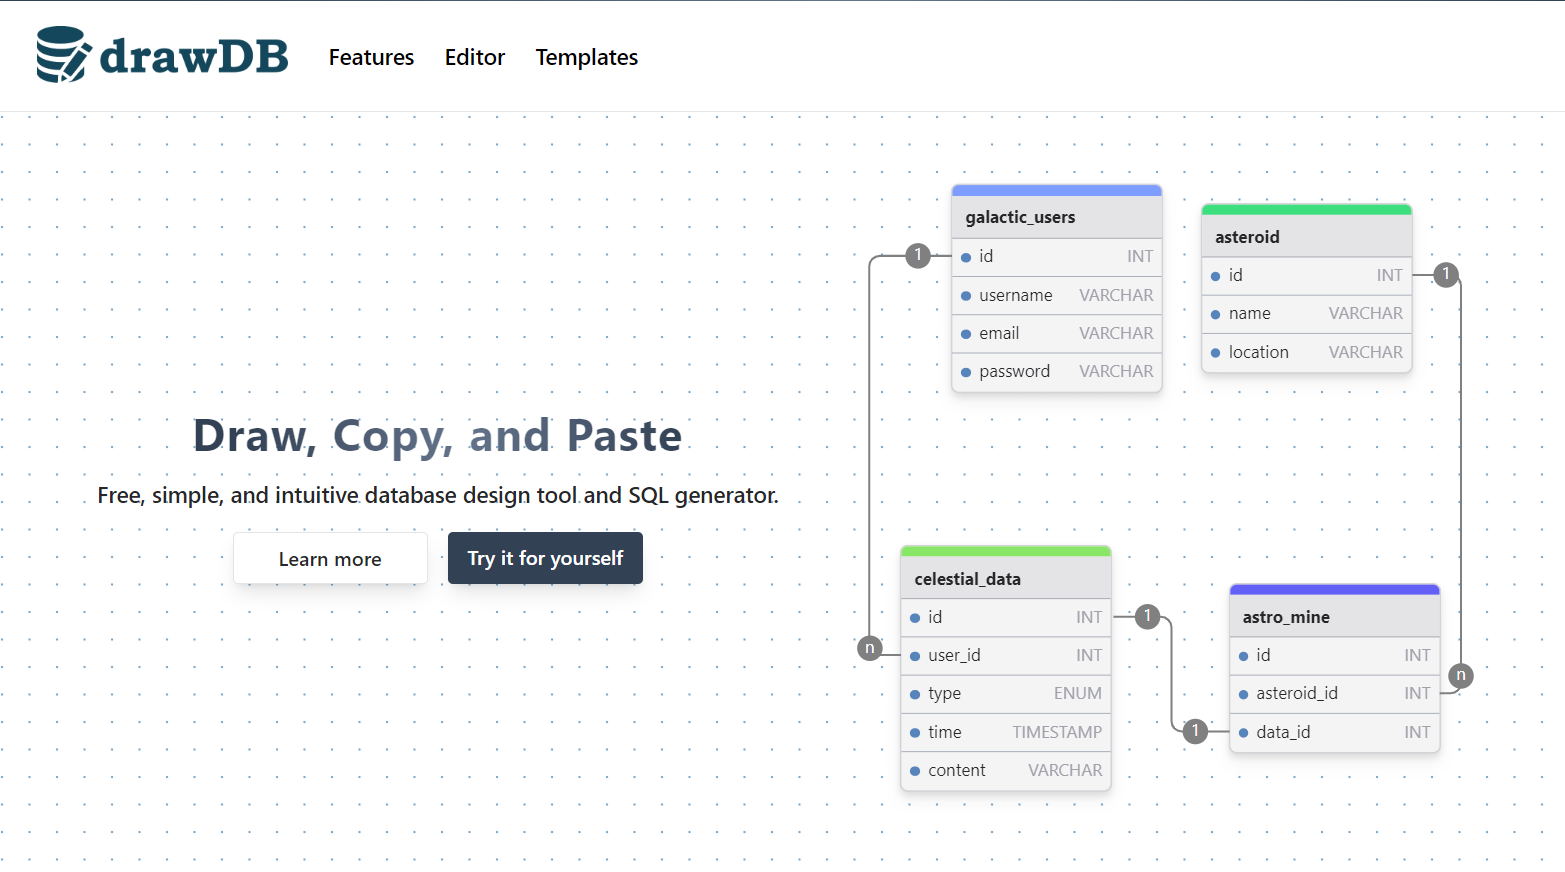
drawDB | Online database diagram editor and SQL generator
Online database entity-relationship diagram editor, data modeler, and SQL generator. Design, visualize, and export scripts without an account and completely free of charge.
Pele is a fast, beautiful, open source renderer for Mermaid diagrams we created for the next version of Obsidian. You can already try it in the Pele playground and integrate it into your own apps! 🌋 pele.run

Pele · Mermaid diagrams as themeable SVG
pele.run
kepano
This is Pele, my new rendering library for diagrams and charts, compatible with the latest Mermaid syntax. - 100-500× faster than mermaid.js - 6× smaller bundle - No dependencies - Easy to theme - Responsive to device width - Open source (MIT) Try it at pele.run
