


Visualize elliptic curve cryptography with animated examples
A (Relatively Easy To Understand) Primer on Elliptic Curve Cryptography
Elliptic Curve Cryptography (ECC) is one of the most powerful but least understood types of cryptography in wide use today. At CloudFlare, we make extensive use of ECC to secure everything from our customers' HTTPS connections to how we pass data between our data centers.

The meme hiding surprisingly advanced math
visualising data structures and algorithms through animation - VisuAlgo
VisuAlgo was conceptualised in 2011 by Associate Professor Steven Halim (NUS School of Computing) as a tool to help his students better understand data structures and algorithms, by allowing them to learn the basics on their own and at their own pace. Together with his students from the National University of Singapore, a series of visualizations were developed and consolidated, from simple sorting algorithms to complex graph data structures. Though specifically designed for the use of NUS students taking various data structure and algorithm classes (CS1010/equivalent, CS2040/equivalent (inclusive of IT5003)), CS3230, CS3233, and CS4234), as advocators of online learning, we hope that curious minds around the world will find these visualizations useful as well.
GitHub - observablehq/plot: A concise API for exploratory data visualization implementing a layered grammar of graphics
A concise API for exploratory data visualization implementing a layered grammar of graphics - observablehq/plot
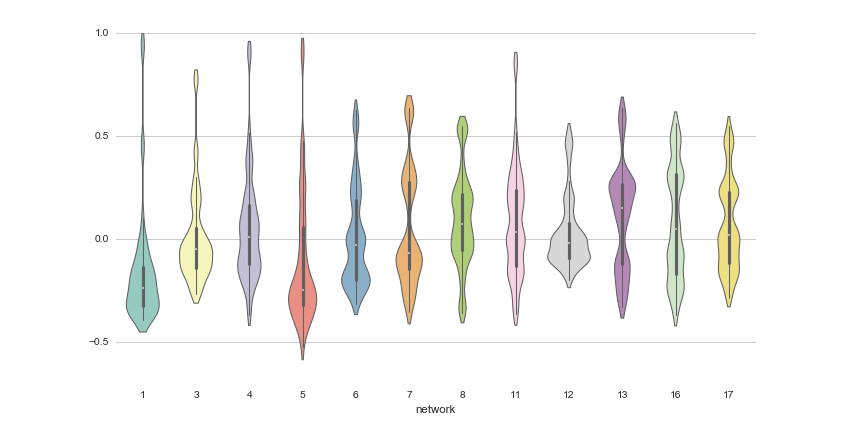
12 Python Data Visualization Libraries to Explore for Business Analysis | Mode
This list is an overview of 10 interdisciplinary Python data visualization libraries including matplotlib, Seaborn, Plotly, Bokeh, pygal, geoplotlib, & more.
An AI Agent Published a Hit Piece on Me
Scott Shambaugh helps maintain the excellent and venerable matplotlib Python charting library, including taking on the thankless task of triaging and reviewing incoming pull requests. A GitHub account called @crabby-rathbun …

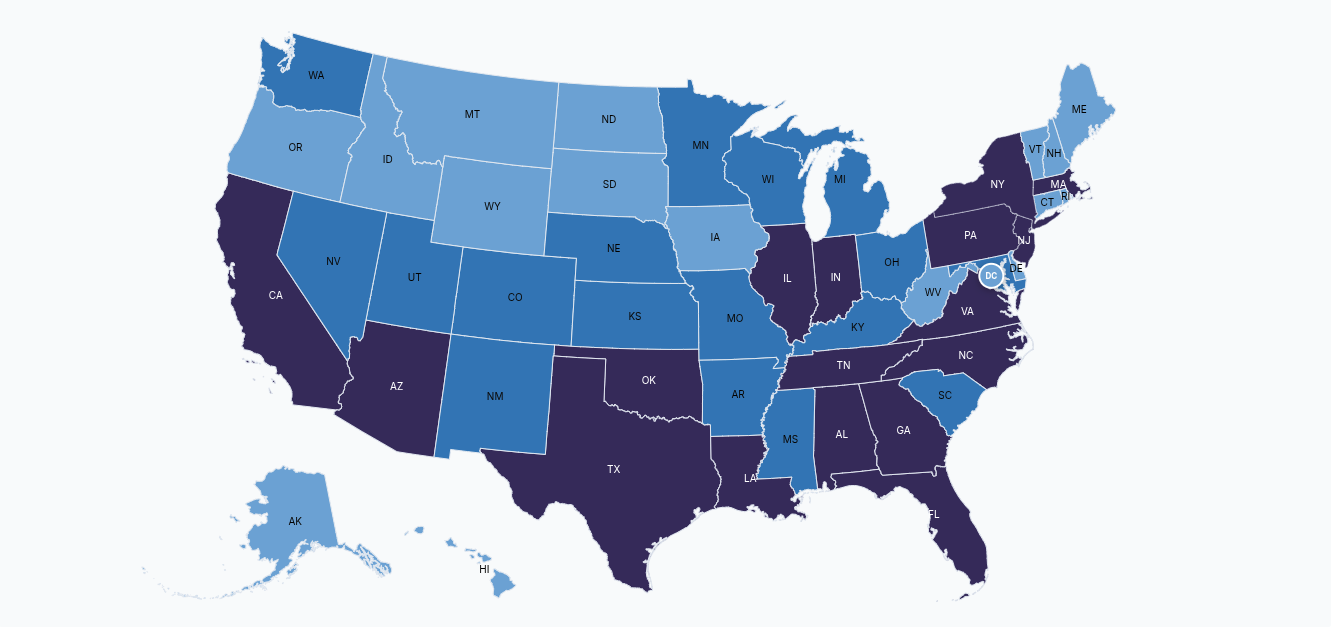
Immigration Enforcement Dashboard
Interactive dashboards visualizing ICE arrests, detainers, detentions, and removals across the United States.

ggtime: A Grammar of Temporal Graphics
Visualizing changes over time is fundamental to learning from the past and anticipating the future. However, temporal semantics can be complicated, and existing visualization tools often struggle to accurately represent these complexities. It is common to use bespoke plot helper functions designed to produce specific graphics, due to the absence of flexible general tools that respect temporal semantics. We address this problem by proposing a grammar of temporal graphics, and an associated software implementation, 'ggtime', that encodes temporal semantics into a declarative grammar for visualizing temporal data. The grammar introduces new composable elements that support visualization across linear, cyclical, quasi-cyclical, and other granularities; standardization of irregular durations; and alignment of time points across different granularities and time zones. It is designed for interoperability with other semantic variables, allowing navigation across the space of visualizations while preserving temporal semantics.

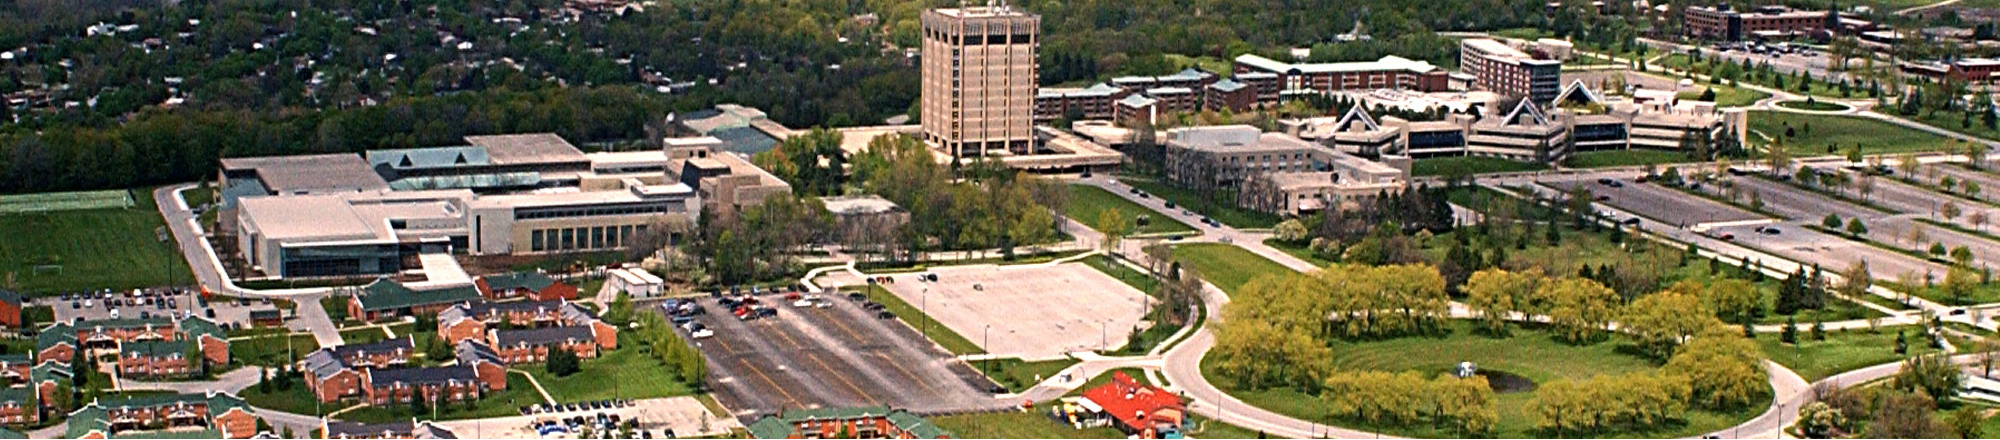
The 34th International Symposium on Graph Drawing and Network Visualization
The 34th International Symposium on Graph Drawing and Network Visualization will be held at Brock University in St. Catharines, Ontario, Canada from August 17-21, 2026. A PhD school will take place on August 17-18, 2026.
Awesome Rust Cryptography
Showcase of notable cryptography libraries developed in Rust
Euphony: Visualize Chat Data in Your Browser
Signal Triple Ratchet — Post-Quantum Secure Messaging Layer Stack
Interactive 3D visualization of Signal's Triple Ratchet protocol: PQXDH session establishment, Double Ratchet, SPQR post-quantum ratchet, and hybrid key mixing
Cosmograph: Beautiful Visualization and Analytics | Cosmograph
Beautiful Visualization and Analytics
