
Create impressive data visualizations with Makie, the plotting ecosystem for the Julia language. Build aesthetic plots with beautiful customizable themes, control every last detail of publication quality vector graphics, assemble complex layouts and quickly prototype interactive applications to explore your data live.
Comparison of plotting packages
I want to write a small 2d physical simulation to sharpen my Julia skills and learn how to use Julia to display more than “regular plots” I saw a post suggesting using either Makie, Plots or Javis I don’t want to start a fan war but would appreciate a comparison of the different use cases where each of the packages shines and where it can be challenging to use

kahliburke/Tachikoma.jl
Build rich terminal apps in Julia — widgets, layouts, sixel graphics, Kitty graphics, animations, and more
GitHub - observablehq/plot: A concise API for exploratory data visualization implementing a layered grammar of graphics
A concise API for exploratory data visualization implementing a layered grammar of graphics - observablehq/plot
Why I no longer recommend Julia
For many years I used the Julia programming language for transforming, cleaning, analyzing, and visualizing data, doing statistics, and performing simulations.
An AI Agent Published a Hit Piece on Me
Scott Shambaugh helps maintain the excellent and venerable matplotlib Python charting library, including taking on the thankless task of triaging and reviewing incoming pull requests. A GitHub account called @crabby-rathbun …
BonitoBook
BonitoBook excels in plotting, customizability, ai integration and language interoperability, making it perfect for exploring data, building dashboards and any other interactive application.
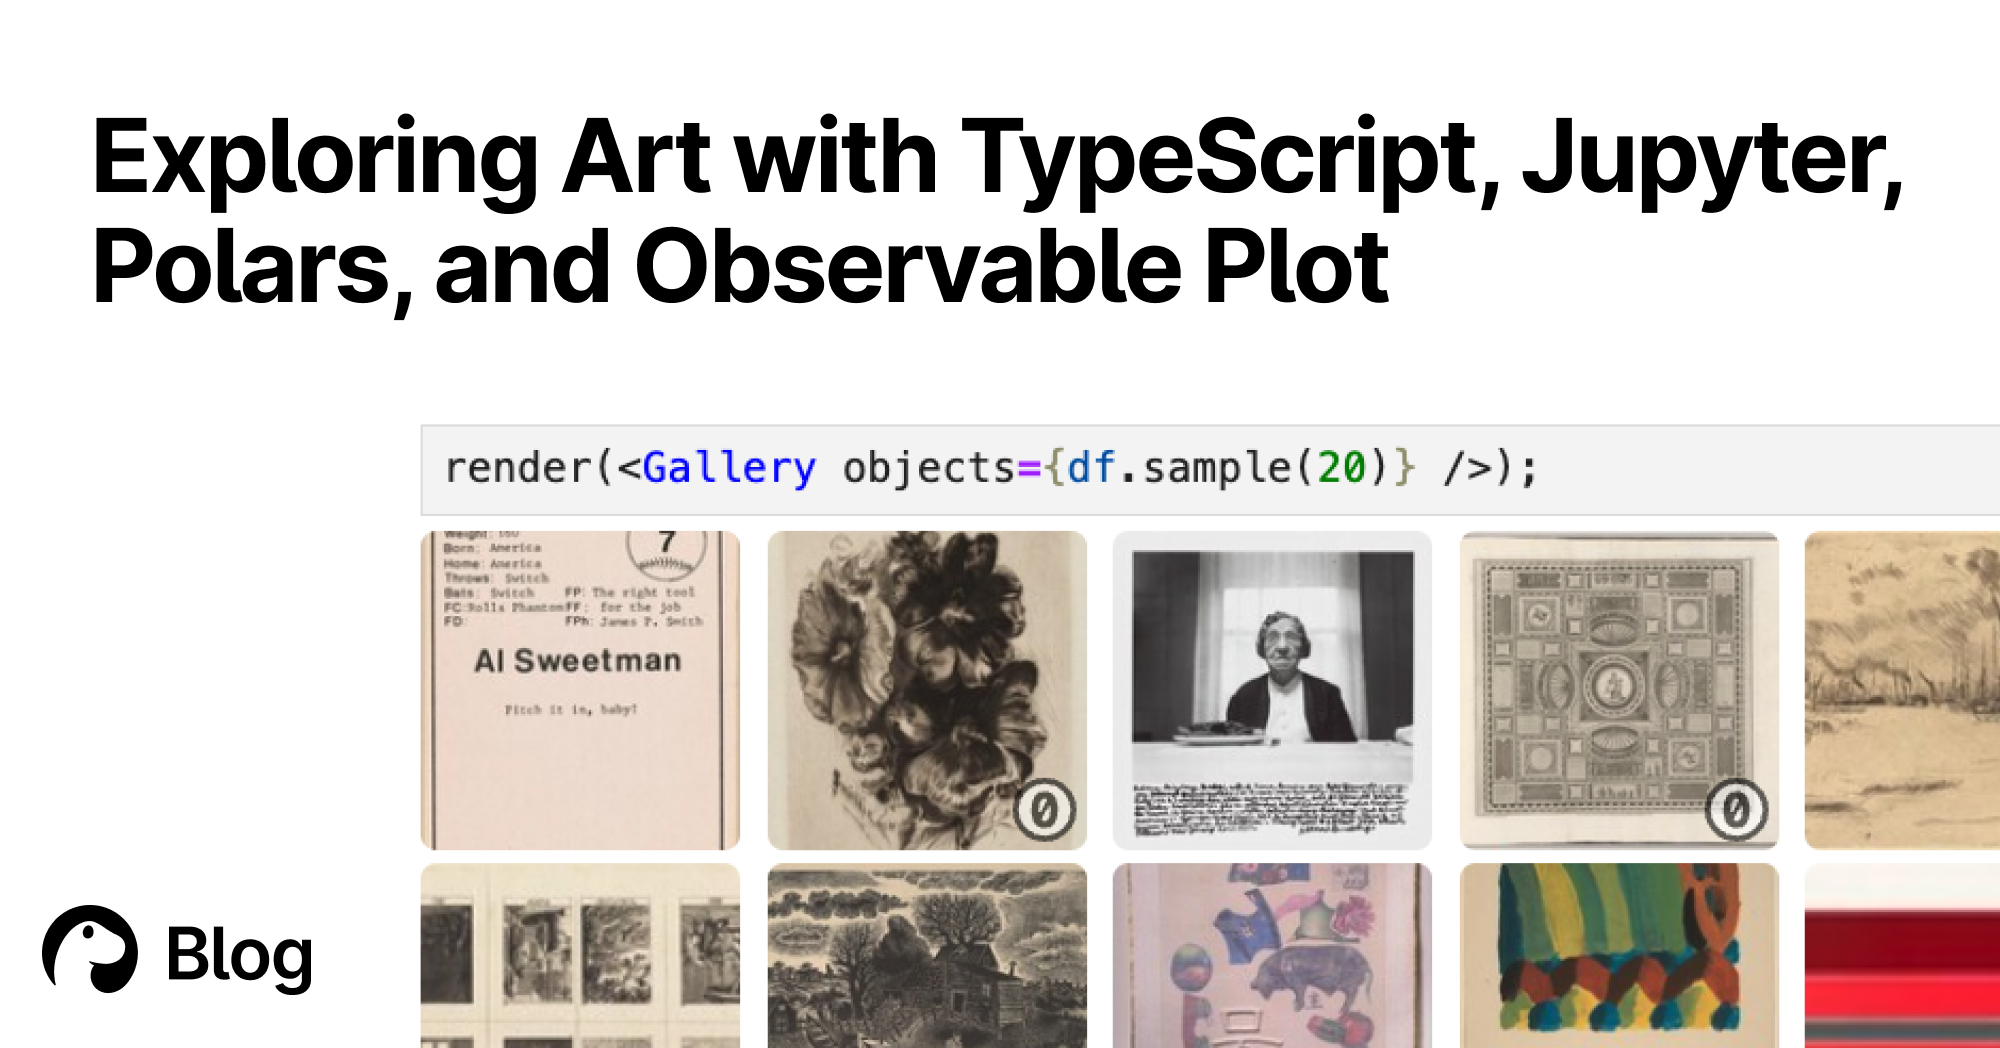
Exploring Art with TypeScript, Jupyter, Polars, and Observable Plot | Deno
With Deno's Jupyter support, you can explore, interact, and create interactive charts with TypeScript and HTML. Here's a tutorial featuring data of over 130,000 famous artworks.

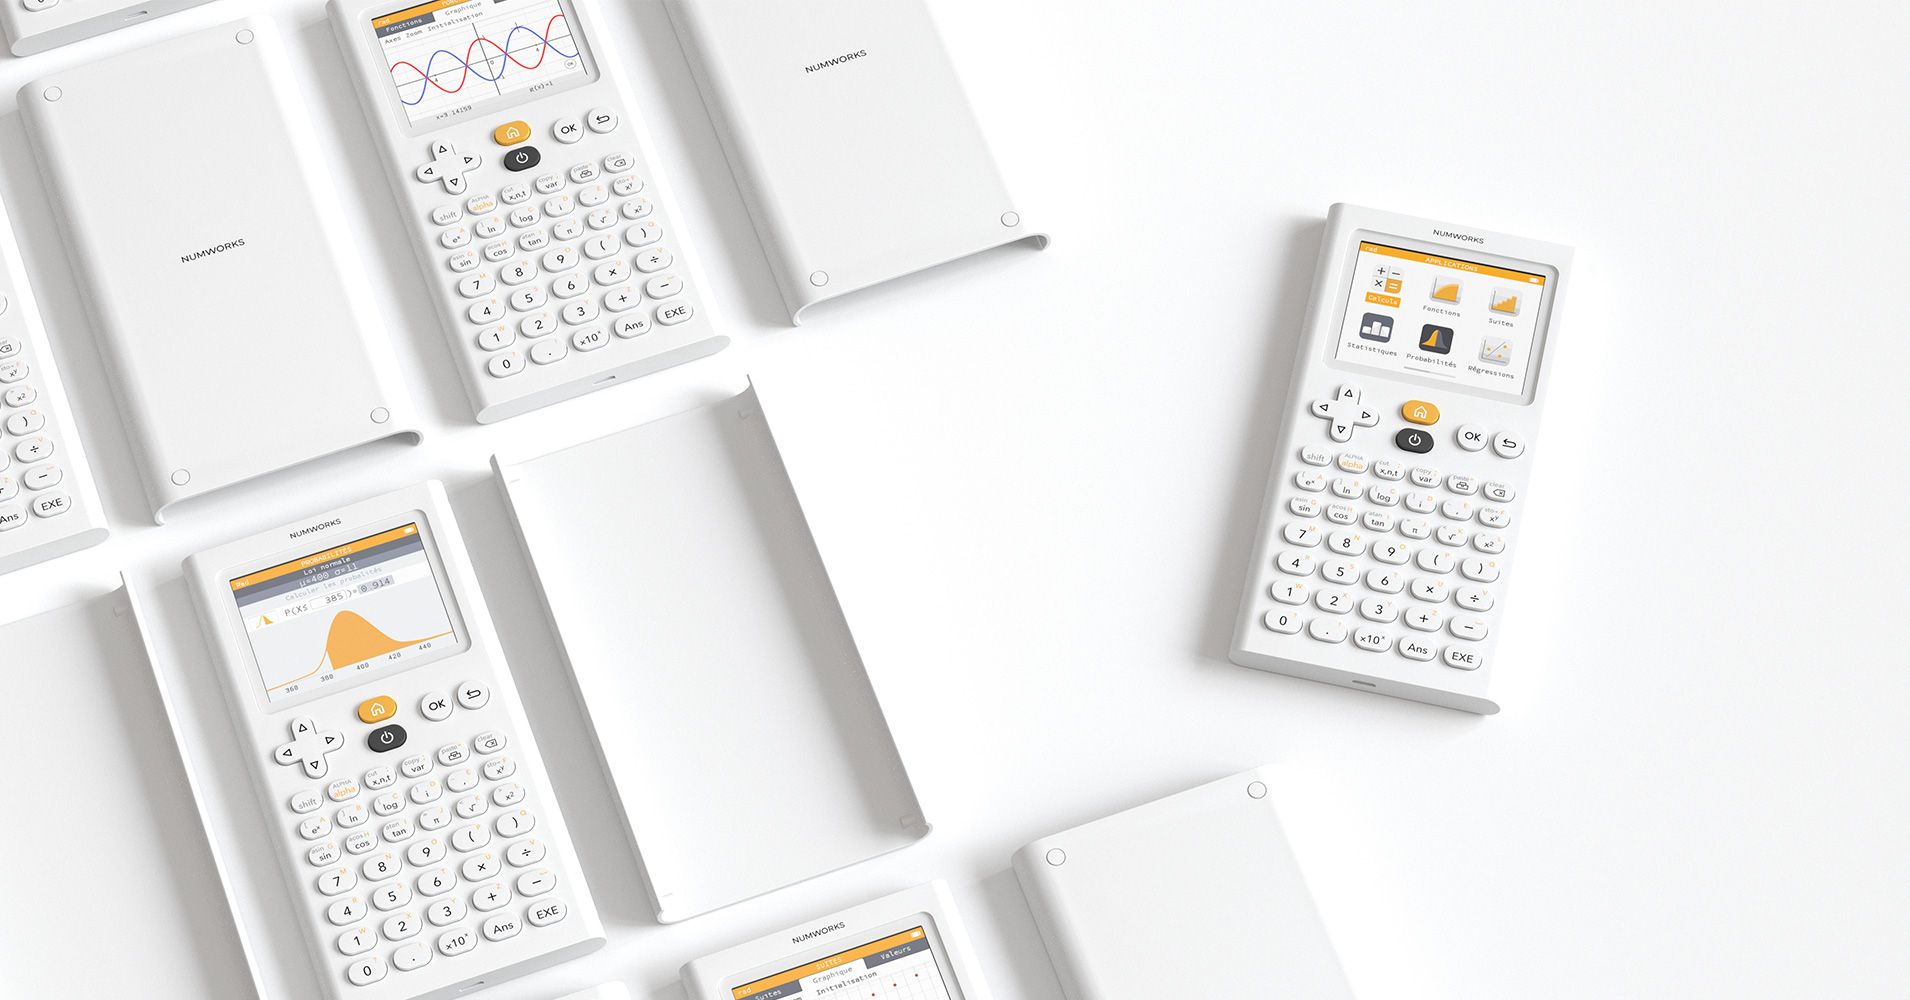
NumWorks Graphing Calculator
The graphing calculator that makes everybody a math person.

Cosmograph: Beautiful Visualization and Analytics | Cosmograph
Beautiful Visualization and Analytics

Create Elegant Data Visualisations Using the Grammar of Graphics
A system for declaratively creating graphics, based on "The Grammar of Graphics". You provide the data, tell ggplot2 how to map variables to aesthetics, what graphical primitives to use, and it takes care of the details.
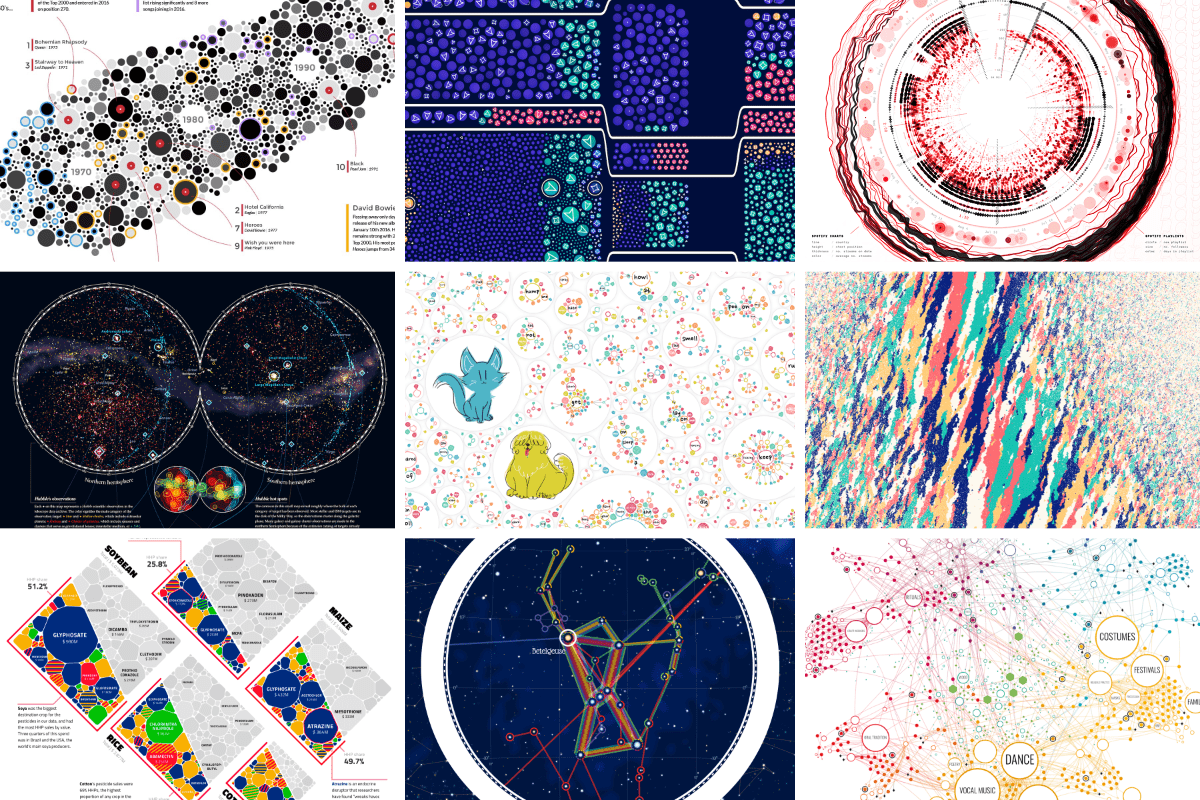
An Award-winning Data Visualization Designer
Visual Cinnamon | Data Visualization Design & Data Art | Data made insightful, effective & beautiful through data visualization and data art
Terminal Graph — A spatial development environment for macOS
See everything. Switch nothing. Terminals, browsers, editors, and notes on one infinite canvas with dataflow connections. Native macOS.