

Flowchart Maker & Online Diagram Software
Chart Design Principles | Hands-On Data Visualization
Tell your story and show it with data, using free and easy-to-learn tools on the web. This introductory book teaches you how to design interactive charts and customized maps for your website, beginning with easy drag-and-drop tools, such as Google Sheets, Datawrapper, and Tableau Public. You will also gradually learn how to edit open-source code templates built with Chart.js, Highcharts, and Leaflet on GitHub. Follow along with the step-by-step tutorials, real-world examples, and online resources. This book is ideal for students, non-profit organizations, small business owners, local governments, journalists, academics, or anyone who wants to tell their story and show the data. No coding experience is required.
Sigma.js
a JavaScript library aimed at visualizing graphs of thousands of nodes and edges
chartgerink - Overview
chartgerink has 41 repositories available. Follow their code on GitHub.

Learn to build unique charts with React
The React Graph Gallery displays hundreds of charts made with React, always with explanation and reproduciible code
Leaving technical preview | GraphQL
After over a year of being open sourced we’re bringing GraphQL out of “technical preview” and relaunching graphql.org.

Semble Multi-User Graph Explorer
The 34th International Symposium on Graph Drawing and Network Visualization
The 34th International Symposium on Graph Drawing and Network Visualization will be held at Brock University in St. Catharines, Ontario, Canada from August 17-21, 2026. A PhD school will take place on August 17-18, 2026.

G6 Graph Visualization Framework in JavaScript
G6 is a graph visualization framework with simplicity and convenience. Based on the ability of customization, it provides elegant graph visualization solutions, helping developers build applications for graph visualization, analysis, and editing.

jwilber/roughViz
Reusable JavaScript library for creating sketchy/hand-drawn styled charts in the browser.
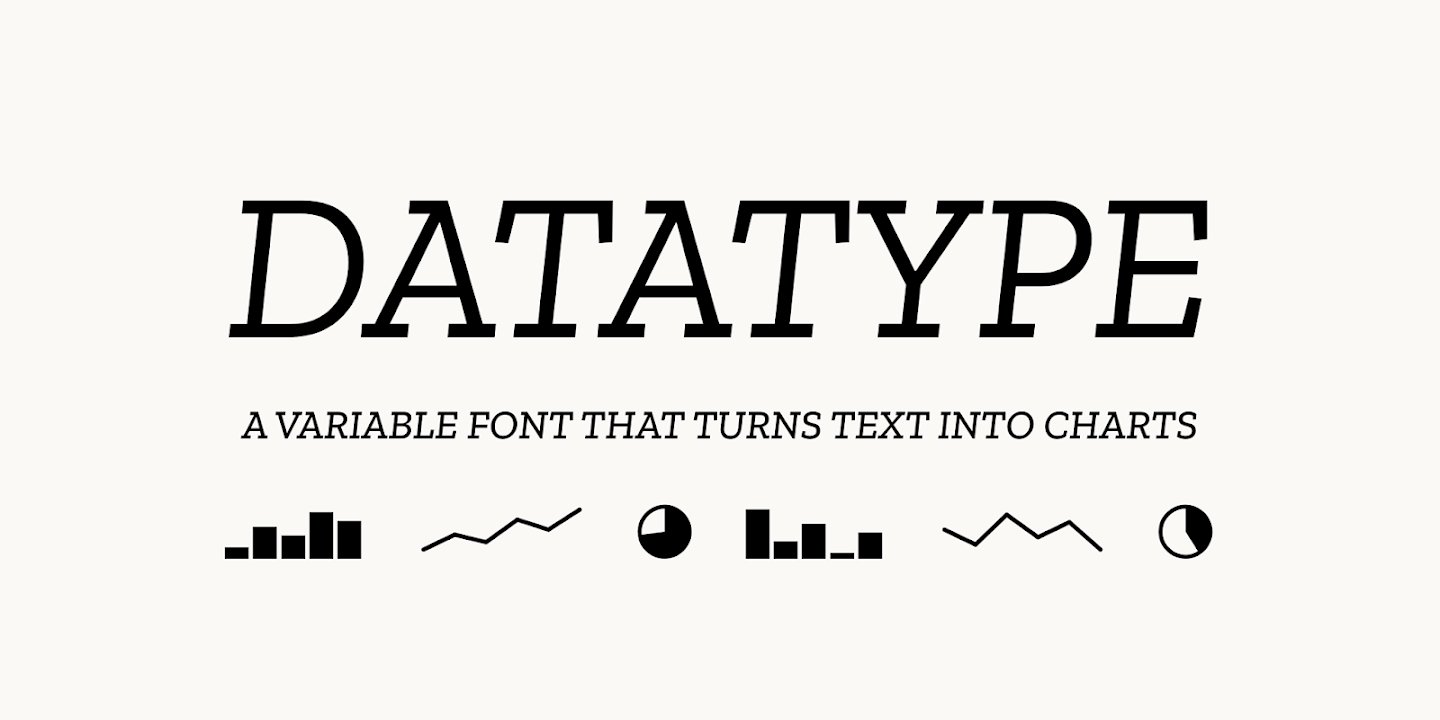
Meet Datatype, my new font that turns text into charts. Available on Google Fonts and of course in Workspace. Simple syntax like {b:10,25,7,95} turns into sparklines, pie charts, and bar charts that look great in your docs, slides, and sheets. https://t.co/0cgEkOcFfM https://t.co/wViF3fPtMr
Meet Datatype, my new font that turns text into charts. Available on Google Fonts and of course in Workspace.Simple syntax like {b:10,25,7,95} turns into sparklines, pie charts, and bar charts that look great in your docs, slides, and sheets.https://t.co/0cgEkOcFfM pic.twitter.com/wViF3fPtMr— Frank Tisellano (@franktisellano) March 12, 2026
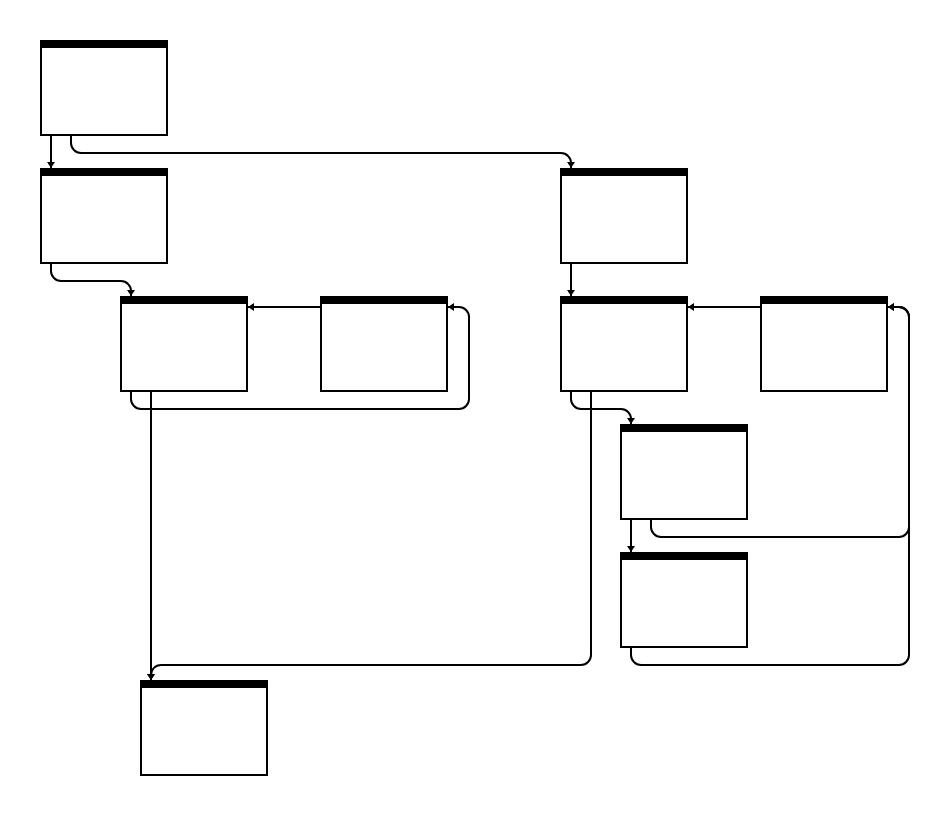
Who needs Graphviz when you can build it yourself?
Exploring a new layout algorithm for control flow graphs.
Really cool idea 🤯 - Install this web font - Just add plain text to the DOM - It renders a chart using font ligatures No JS, no hydration FOUC franktisellano.github.io/datatype/
