

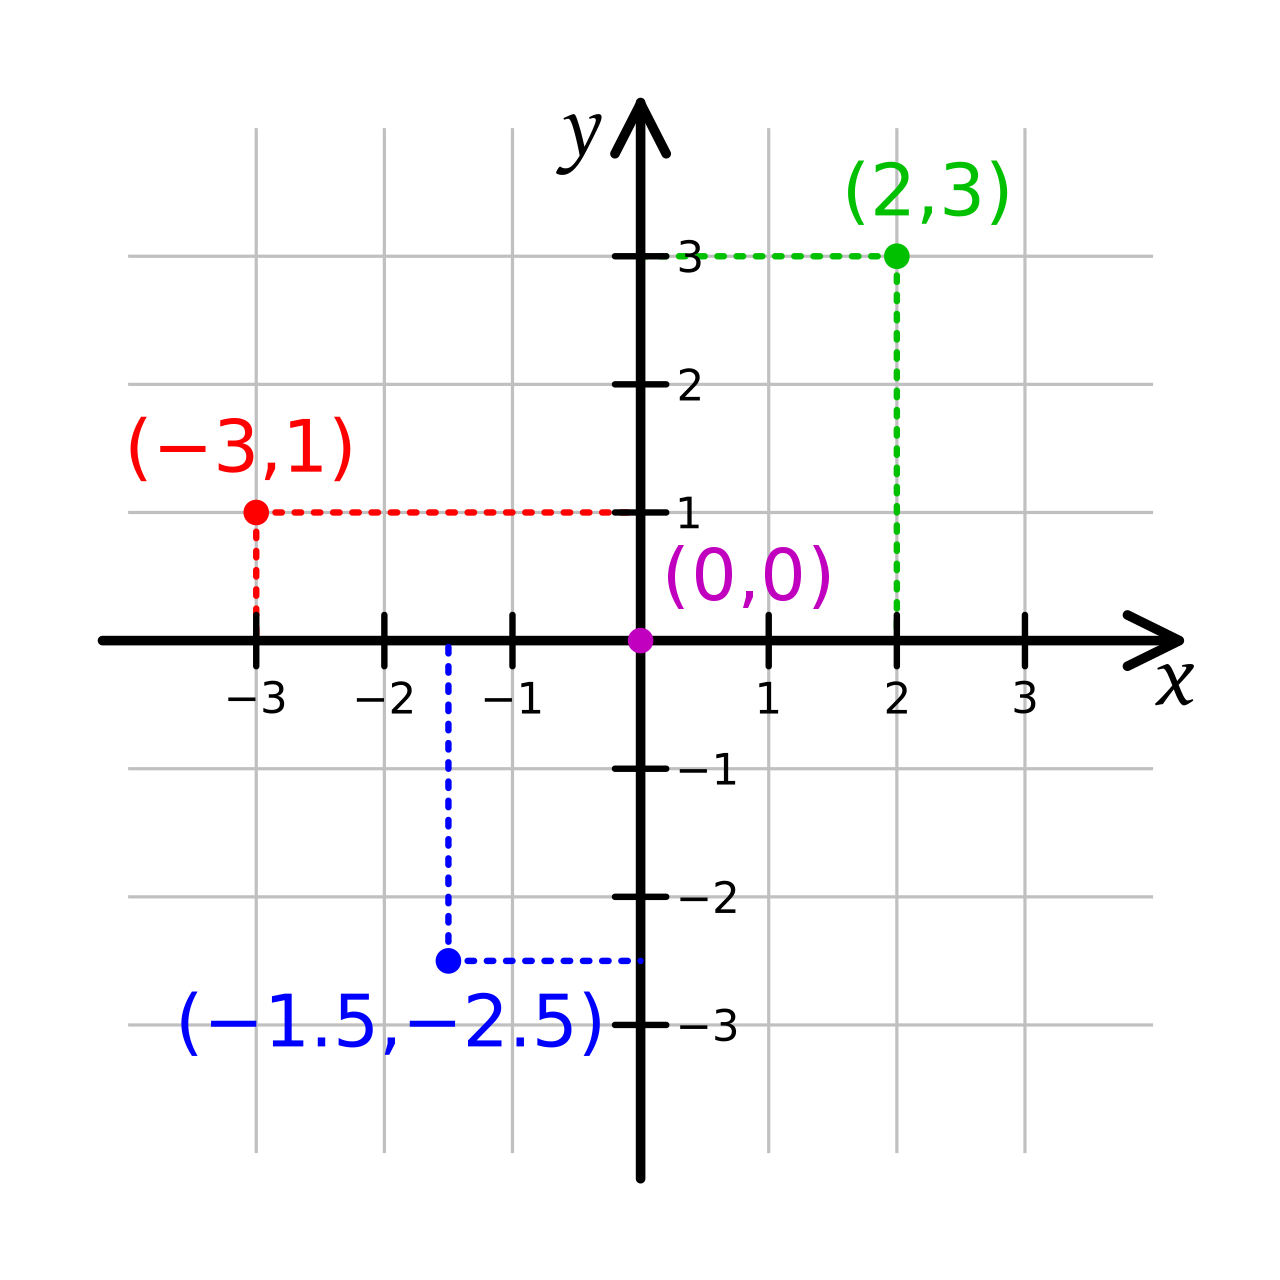
In geometry, a Cartesian coordinate system in a plane is a coordinate system that specifies each point uniquely by a pair of real numbers called coordinates, which are the signed distances to the point from two fixed perpendicular oriented lines, called coordinate lines, coordinate axes or just axes of the system. The point where the axes meet is called the origin and has (0, 0) as coordinates. The axes directions represent an orthogonal basis. The combination of origin and basis forms a coordinate frame called the Cartesian frame.
Tensor
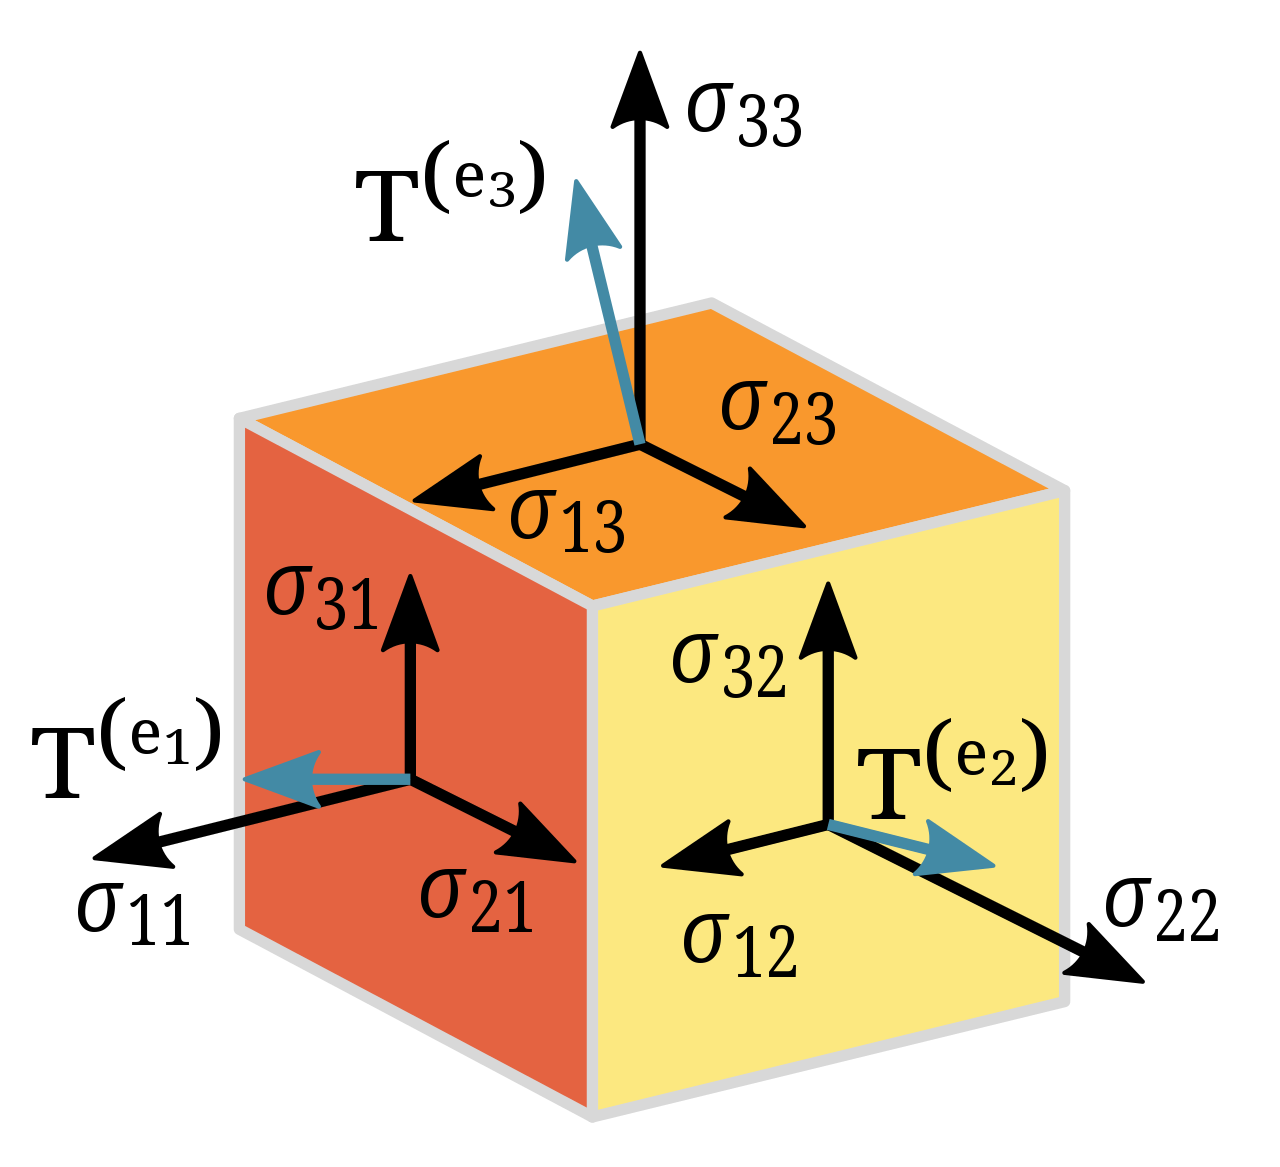
In mathematics, a tensor is an algebraic object that describes a multilinear relationship between sets of algebraic objects associated with a vector space. Tensors may map between different objects such as vectors, scalars, and even other tensors. There are many types of tensors, including scalars and vectors, dual vectors, multilinear maps between vector spaces, and even some operations such as the dot product. Tensors are defined independent of any basis, although they are often referred to by their components in a basis related to a particular coordinate system; those components form an array, which can be thought of as a high-dimensional matrix.
Visual Variables
Visual variables are “the differences in map elements as perceived by the human eye” (wiki.gis.com). No matter what the type of map, these are the fundamental ways in which graphic symbols can be distinguished.
Social system
In sociology, a social system is the patterned network of relationships constituting a coherent whole that exist between individuals, groups, and institutions. It is the formal structure of role and status that can form in a small, stable group. An individual may belong to multiple social systems at once; examples of social systems include nuclear family units, communities, cities, nations, college campuses, religions, corporations, and industries. The organization and definition of groups within a social system depend on various shared properties such as location, socioeconomic status, race, religion, societal function, or other distinguishable features.

Bureau des longitudes
Le Bureau des longitudes est une académie composée d’astronomes, de géophysiciens et de physiciens issus de laboratoires ou institutions français ou étrangers. Il comprend 13 membres titulaires français, un nombre variable de membres en service extraordinaire et 32 correspondants français ou étrangers. Il a, notamment, le mandat de garantir et définir les missions de service public confiées à l’Institut de mécanique céleste et de calcul des éphémérides.
Yi Ma on Twitter / X
In system theory, it is called "linearization"... which has been studied and used for decades. Honestly, folks, there is no need to invent or introduce any new terminology. Remember, there is rarely anything new under the sun... https://t.co/yNLIv7Ptoh— Yi Ma (@YiMaTweets) March 14, 2026
A cartographer posits that our maps should be messier. “The ...
A cartographer posits that our maps should be messier. “The idea that we must have a crisp line dividing one country from another is often inaccurate when it co
Radial
Coordinate humans and coding agents on software goals. Every unit of agent work is requested by a human and lands as a signed, reviewable artifact in its author’s own atproto repo — no central server.

Manifold hypothesis
The manifold hypothesis posits that many high-dimensional data sets that occur in the real world actually lie along low-dimensional latent manifolds inside that high-dimensional space.[1][2][3][4] As a consequence of the manifold hypothesis, many data sets that appear to initially require many variables to describe, can actually be described by a comparatively small number of variables, linked to the local coordinate system of the underlying manifold. It is suggested that this principle underpins the effectiveness of machine learning algorithms in describing high-dimensional data sets by considering a few common features.
Functional Programmers need to take a look at Zig.
I’ve been tinkering around with Zig to explore what’s possible with comptime. Whenever I evaluate a new language I use three axes:
Cosine similarity
In data analysis, cosine similarity is a measure of similarity between two non-zero vectors defined in an inner product space. Cosine similarity is the cosine of the angle between the vectors; that is, it is the dot product of the vectors divided by the product of their lengths. It follows that the cosine similarity does not depend on the magnitudes of the vectors, but only on their angle. The cosine similarity always belongs to the interval [ − 1 , + 1 ] . {\displaystyle [-1,+1].} For example, two proportional vectors have a cosine similarity of +1, two orthogonal vectors have a similarity of 0, and two opposite vectors have a similarity of −1. In some contexts, the component values of the vectors cannot be negative, in which case the cosine similarity is bounded in [ 0 , 1 ] {\displaystyle [0,1]} .
The purpose of a system is what it does
The purpose of a system is what it does (POSIWID) is a heuristic in systems thinking coined by the British management consultant Stafford Beer,[1] who stated that there is "no point in claiming that the purpose of a system is to do what it constantly fails to do".[2] It is widely used by systems theorists, and is generally invoked to counter the notion that the purpose of a system can be read from the intentions of those who design, operate or promote it. When a system's side effects or unintended consequences reveal that its behaviour is poorly understood, then the POSIWID perspective can balance political understandings of system behaviour with a more straightforwardly descriptive view.
Prof. Judy Fan: Cognitive Tools for Making the Invisible Visible
Prof. Judy Fan: Cognitive Tools for Making the Invisible Visible
Tom Costello on Twitter / X
Apropos of everything here’s my uninformed idea for alignment: homeostatic mechanisms (control systems / cybernetics) that force a system to optimize for satiation and normal-range variation (rather than maximization) across a set of goals such that, if any one of them were…— Tom Costello (@tomstello_) September 9, 2026
Introduction — pyNomo Documentation 0.3.2.2 documentation
A nomogram or nomograph is a diagram that provides an easy, graphical way of calculating the result of a mathematical formula. Sometimes also called an alignment chart, a nomogram consists of a set of numbered scales, usually one for each variable in the formula, arranged so that a straightedge can be placed across known values to find the unknown value that solves the formula. Since an equation in two variables is usually represented by a graph, most nomograms represent formulas that involve three or more variables.
The operad of wiring diagrams: formalizing a graphical language for databases, recursion, and plug-and-play circuits
Wiring diagrams, as seen in digital circuits, can be nested hierarchically and thus have an aspect of self-similarity. We show that wiring diagrams form the morphisms of an operad $\mcT$, capturing this self-similarity. We discuss the algebra $\Rel$ of mathematical relations on $\mcT$, and in so doing use wiring diagrams as a graphical language with which to structure queries on relational databases. We give the example of circuit diagrams as a special case. We move on to show how plug-and-play devices and also recursion can be formulated in the operadic framework as well. Throughout we include many examples and figures.
