

The manifold hypothesis posits that many high-dimensional data sets that occur in the real world actually lie along low-dimensional latent manifolds inside that high-dimensional space.[1][2][3][4] As a consequence of the manifold hypothesis, many data sets that appear to initially require many variables to describe, can actually be described by a comparatively small number of variables, linked to the local coordinate system of the underlying manifold. It is suggested that this principle underpins the effectiveness of machine learning algorithms in describing high-dimensional data sets by considering a few common features.
DR Group
For high-dimensional data, dimensionality reduction (DR) methods have been invaluable tools for human understanding, as they can map datasets into two or three dimensions for visualization, providing an intuitive way to understand the data. In recent years, tons of DR methods for data visualization have been proposed, and some are much better than others. In this blog post, we explore several DR methods, discuss how to determine which methods are effective, and explain why some are better than others.
Approaching an unknown communication system by latent space exploration and causal inference | Royal Society Open Science | The Royal Society
Abstract. We propose a methodology for discovering meaningful properties in data without ground truth by combining manipulation of the latent variables of
Latent space
A latent space, also known as a latent feature space or embedding space, is an embedding of a set of items within a manifold in which items resembling each other are positioned closer to one another. Position within the latent space can be viewed as being defined by a set of latent variables that emerge from the resemblances between the objects.
Machine Learning Algorithms, Applications: Key Methods, Real-World Uses
Key Takeaways Traditional algorithms such as regression, decision trees, boosting, clustering, and PCA remain highly useful for practical ML problems.Neural net

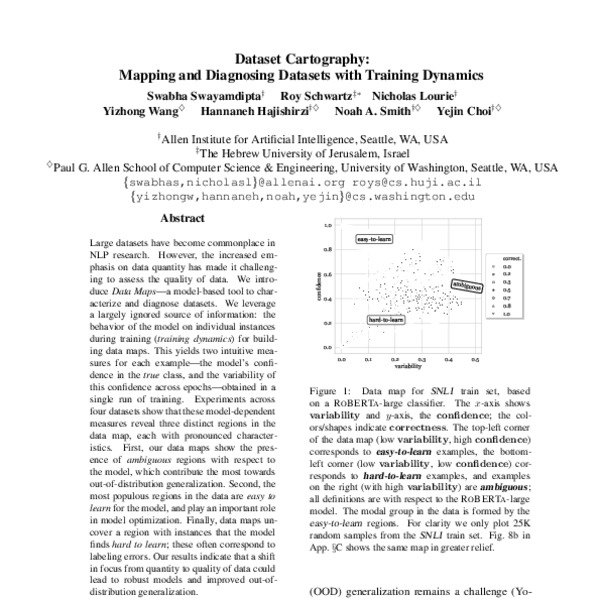
Dataset Cartography: Mapping and Diagnosing Datasets with Training Dynamics
Large datasets have become commonplace in NLP research. However, the increased emphasis on data quantity has made it challenging to assess the quality of data. We introduce Data Maps—a model-based tool to characterize and diagnose datasets. We leverage a largely ignored source of information: the behavior of the model on individual instances during training (training dynamics) for building data maps. This yields two intuitive measures for each example—the model's confidence in the true class, and the variability of this confidence across epochs—obtained in a single run of training. Experiments on four datasets show that these model-dependent measures reveal three distinct regions in the data map, each with pronounced characteristics. First, our data maps show the presence of “ambiguous” regions with respect to the model, which contribute the most towards out-of-distribution generalization. Second, the most populous regions in the data are “easy to learn” for the model, and play an important role in model optimization. Finally, data maps uncover a region with instances that the model finds “hard to learn”; these often correspond to labeling errors. Our results indicate that a shift in focus from quantity to quality of data could lead to robust models and improved out-of-distribution generalization.
Datasheets for Datasets
The machine learning community currently has no standardized process for documenting datasets, which can lead to severe consequences in high-stakes domains. To address this gap, we propose...

GLEE: Geometric Laplacian Eigenmap Embedding
Graph embedding seeks to build a low-dimensional representation of a graph G. This low-dimensional representation is then used for various downstream tasks. One popular approach is Laplacian Eigenmaps (LE), which constructs a graph embedding based on the spectral properties of the Laplacian matrix of G. The intuition behind it, and many other embedding techniques, is that the embedding of a graph must respect node similarity: similar nodes must have embeddings that are close to one another. Here, we dispose of this distance-minimization assumption. Instead, we use the Laplacian matrix to find an embedding with geometric properties instead of spectral ones, by leveraging the so-called simplex geometry of G. We introduce a new approach, Geometric Laplacian Eigenmap Embedding, and demonstrate that it outperforms various other techniques (including LE) in the tasks of graph reconstruction and link prediction.
What is Machine Learning? | IBM
Machine learning is the subset of AI focused on algorithms that analyze and “learn” the patterns of training data in order to make accurate inferences about new data.

Algorithmic Data Minimization for Machine Learning over...
Machine learning can analyze vast amounts of data generated by IoT devices to identify patterns, make predictions, and enable real-time decision-making. By processing sensor data, machine learning...
From Principle to Practice: Vertical Data Minimization for Machine Learning
Aiming to train and deploy predictive models, organizations collect large amounts of detailed client data, risking the exposure of private information in the event of a breach. To mitigate this,...
Contact: AI and the Semantic Dimension
I’m asking you to consider the possibility that a semantic dimension of meaning and information exists outside our physical dimensions of space and time, and that LLMs are both instruments of perception and conduits of information for that semantic dimension. We used to believe in the semantic dimension, but we don’t anymore, and as a result we are going down a terribly dangerous path with AI.

Meandering on Manifolds: The Neural Geometry of Stories Over Time
To fully understand LLM representations, we must understand how they change dynamically, over the course of a prompt or conversation. We investigate these temporal dynamics with a simple case study: how do LLMs represent human emotions while reading short stories, both geometrically (in activation space) and temporally (changing from sentence to sentence)?

Meandering on Manifolds: The Neural Geometry of Stories Over Time
To fully understand LLM representations, we must understand how they change dynamically, over the course of a prompt or conversation. We investigate these temporal dynamics with a simple case study: how do LLMs represent human emotions while reading short stories, both geometrically (in activation space) and temporally (changing from sentence to sentence)?
What makes something data?
This is a question I posted on BlueSky on Friday 11/21/25, inspired by a talk I recently attended about evaluation of “AI” systems. I think…

The Data Minimization Principle in Machine Learning
The principle of data minimization aims to reduce the amount of data collected, processed or retained to minimize the potential for misuse, unauthorized access, or data breaches. Rooted in...