

FiftyPlusOne - Latest Political Polls and Averages
A comprehensive list of polls and polling averages for elections and politician approval.

Polls (/c/Polls) - OddsRabbit
This community is just for polls - polls on literally anything your heart desires! Ask all the multiple choice questions you can think of!

Election polling errors across time and space
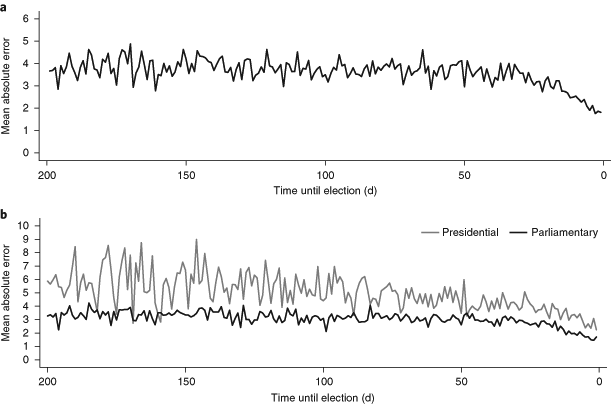
Are election polling misses becoming more prevalent? Are they more likely in some contexts than others? Here we undertake an over-time and cross-national assessment of prediction errors in pre-election polls. Our analysis draws on more than 30,000 national polls from 351 general elections in 45 countries between 1942 and 2017. We proceed in the following way. First, building on previous studies, we show how errors in national polls evolve in a structured way over the election timeline. Second, we examine errors in polls in the final week of the election campaign to assess performance across election years. Third, we undertake a pooled analysis of polling errors—controlling for a number of institutional and party features—that enables us to test whether poll errors have increased or decreased over time. We find that, contrary to conventional wisdom, the recent performance of polls has not been outside the ordinary. However, the performance of polls does vary across political contexts and in understandable ways.
An Assessment of the Causes of the Errors in the 2015 UK Gseneral Election Opinion Polls
Summary The opinion polls that were undertaken before the 2015 UK general election underestimated the Conservative lead over Labour by an average of 7 percentage points. This collective failure led politicians and commentators to question the validity and utility of political polling and raised concerns regarding a broader public loss of confidence in survey research. We assess the likely causes of the 2015 polling errors. We begin by setting out a formal account of the statistical methodology and assumptions that are required for valid estimation of party vote shares by using quota sampling. We then describe the current approach of polling organizations for estimating sampling variability and suggest a new method based on bootstrap resampling. Next, we use poll microdata to assess the plausibility of different explanations of the polling errors. Our conclusion is that the primary cause of the polling errors in 2015 was unrepresentative sampling.

The Performance of the Polls in the 2019 General Election - British Polling Council
The Performance of the Polls in the 2019 General Election
Subscribe to Strength In Numbers
Independent, data-driven analysis of politics, public opinion polls, and elections. From author, journalist, and pollster G. Elliott Morris. Click to read Strength In Numbers, by G. Elliott Morris, a Substack publication with tens of thousands of subscribers.
Subscribe to Strength In Numbers
Independent, data-driven analysis of politics, public opinion polls, and elections. From author, journalist, and pollster G. Elliott Morris. Click to read Strength In Numbers, by G. Elliott Morris, a Substack publication with tens of thousands of subscribers.
The Twilight of the Polls? A Review of Trends in Polling Accuracy and the Causes of Polling Misses
Polls have had a number of high-profile misses in recent elections. We review the current polling environment, the performance of polls in a historical context, the mechanisms of polling error, and the causes of several recent misses in Britain and the US. Contrary to conventional wisdom, polling errors have been constant over time, although the level of error has always been substantially beyond that implied by stated margins of error. Generally, there is little evidence that voters lying about their vote intention (so-called ‘shy’ voters) is a substantial cause of polling error. Instead, polling errors have most commonly resulted from problems with representative samples and weighting, undecided voters breaking in one direction, and to a lesser extent late swings and turnout models. We conclude with a discussion of future directions for polling both in terms of fixing the problems identified and new approaches to understanding public opinion.

Victorian election polls 2026 — average and ledger — Australian Election Tracker
Victorian state election 2026 polls: sourced statewide primary votes and a transparent weighted average with uncertainty bands. Latest tracker average (as of 2026-10-10): Labor 24.5%, Coalition 29.1%, One Nation 22.6%, Greens 14.9%, Others 8.9%. Not a forecast.

Why does every poll seem to show a tossup now?
Campaigns see internal polls as tools for fundraising
Wave Dashboard
Interactive MRP estimates of American public opinion for every state and congressional district, from Wave's MOSAIC model.

poll.blue — polls for the Atmosphere
Create polls on Bluesky. Sign in with your account, post a poll, and watch the results roll in.
poll.blue — polls for the Atmosphere
Create polls on Bluesky. Sign in with your account, post a poll, and watch the results roll in.
Opinion | This Is What Will Ruin Public Opinion Polling for Good
Instead of navigating the obstacles to conduct polls with human respondents, pollsters are running A.I. simulations instead. Why?

Exit polls: Election 2025 | CNN Politics
See exit polls data for the 2025 US elections. For more information on voting and election results, visit cnn.com/election.

New YouGov/Economist poll out this AM has Democrats up 11 points on the House vote among likely voters. This is with named candidates, not the usual "generic ballot," which in my testing with CES data is typically more accurate in forecasting outcomes d3nkl3psvxxpe9.cloudfront.net/documents/econTabReport_SlcWd…
A comprehensive list of polls and polling averages for elections and politician approval.
