

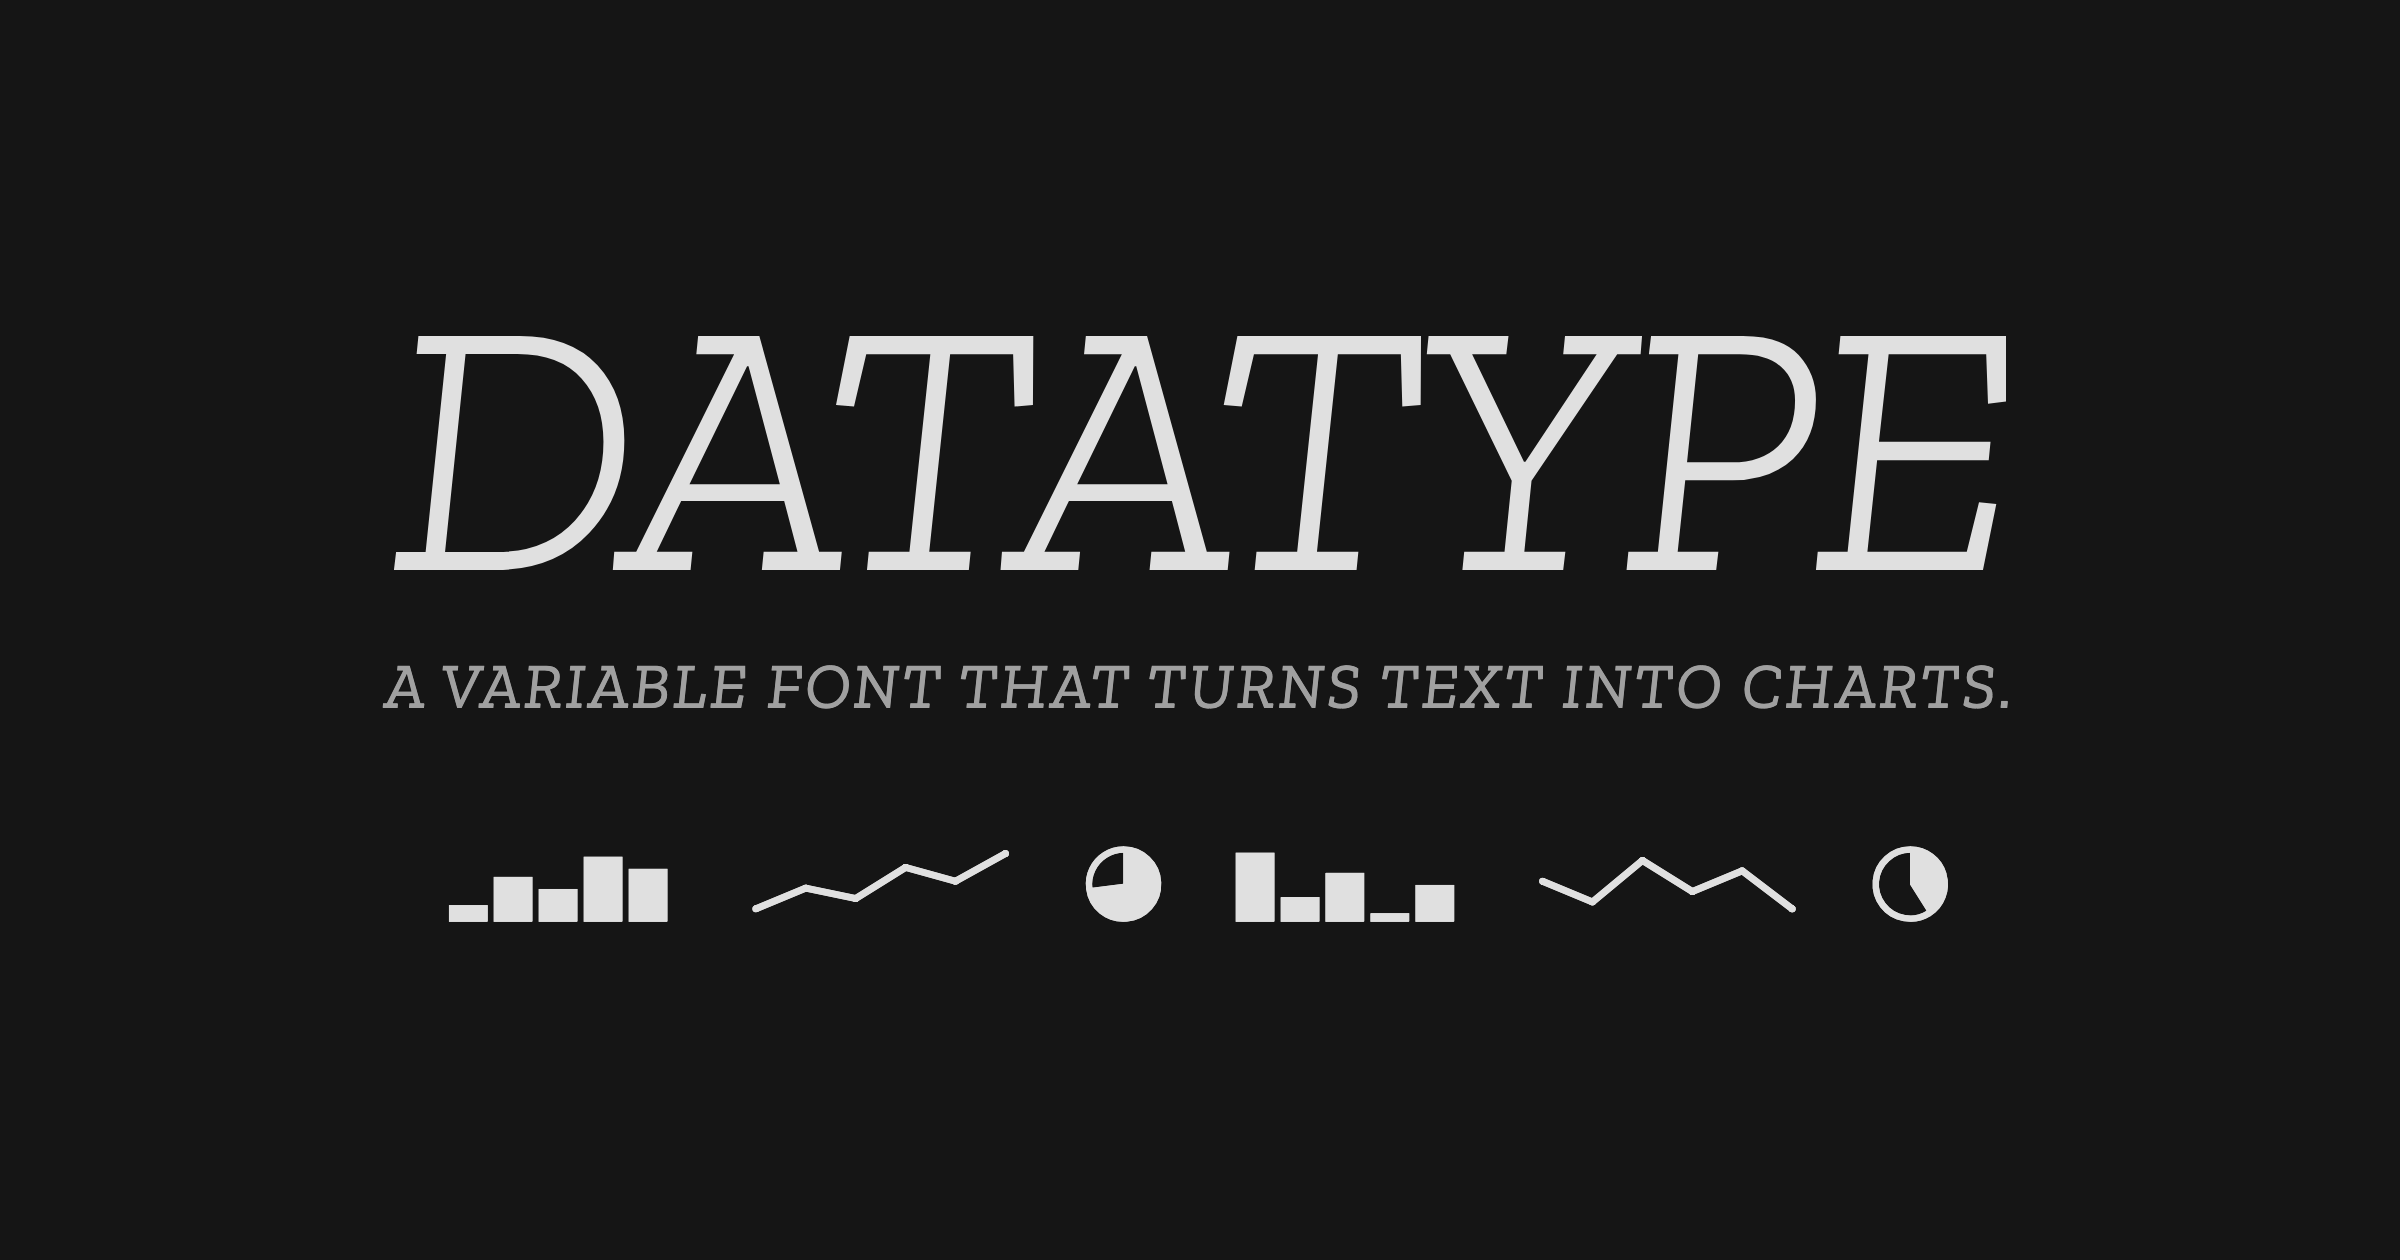
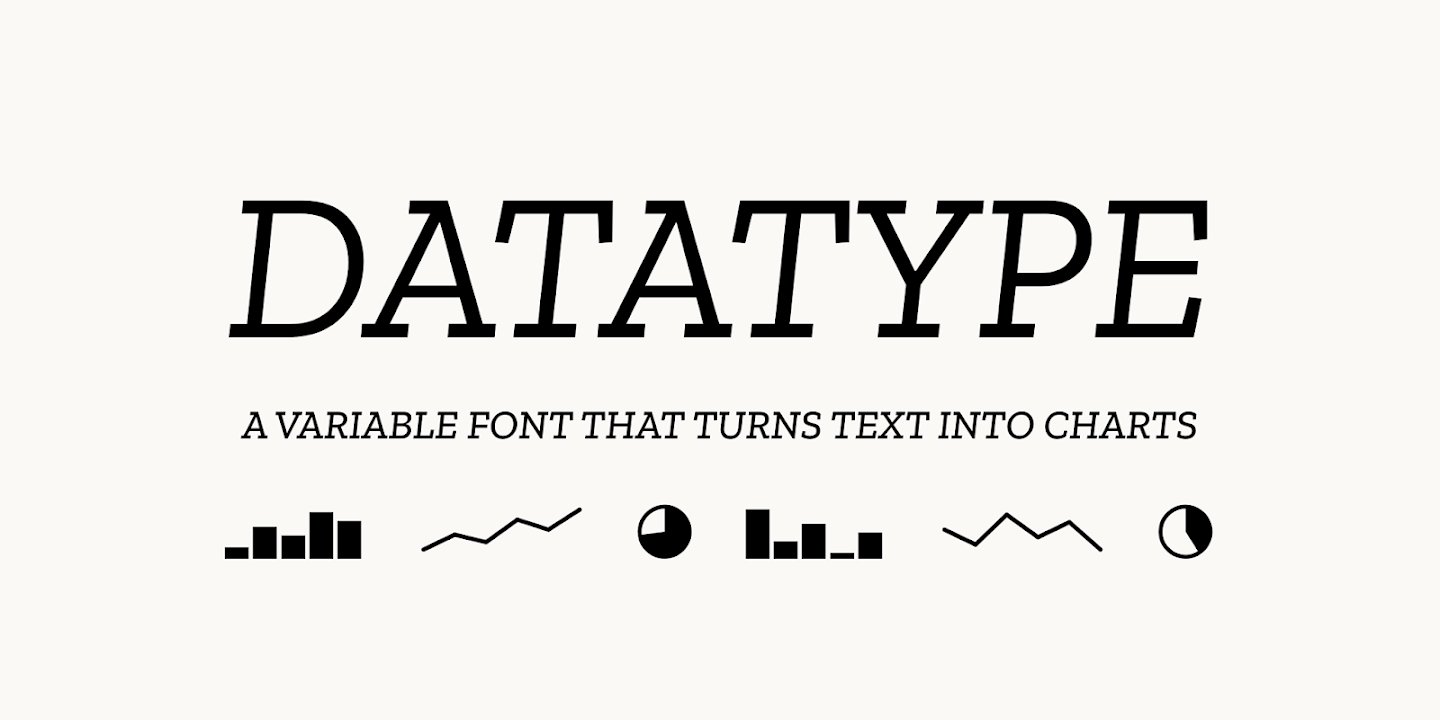
An OpenType variable font that turns simple text expressions into inline charts. No JavaScript, no images — just type.
Meet Datatype, my new font that turns text into charts. Available on Google Fonts and of course in Workspace. Simple syntax like {b:10,25,7,95} turns into sparklines, pie charts, and bar charts that look great in your docs, slides, and sheets. https://t.co/0cgEkOcFfM https://t.co/wViF3fPtMr
Meet Datatype, my new font that turns text into charts. Available on Google Fonts and of course in Workspace.Simple syntax like {b:10,25,7,95} turns into sparklines, pie charts, and bar charts that look great in your docs, slides, and sheets.https://t.co/0cgEkOcFfM pic.twitter.com/wViF3fPtMr— Frank Tisellano (@franktisellano) March 12, 2026
Font with Built-In Syntax Highlighting
An experiment in javascript-free syntax highlighting, made possible by opentype contextual alternates and COLR table

Chart Design Principles | Hands-On Data Visualization
Tell your story and show it with data, using free and easy-to-learn tools on the web. This introductory book teaches you how to design interactive charts and customized maps for your website, beginning with easy drag-and-drop tools, such as Google Sheets, Datawrapper, and Tableau Public. You will also gradually learn how to edit open-source code templates built with Chart.js, Highcharts, and Leaflet on GitHub. Follow along with the step-by-step tutorials, real-world examples, and online resources. This book is ideal for students, non-profit organizations, small business owners, local governments, journalists, academics, or anyone who wants to tell their story and show the data. No coding experience is required.
TanStack Charts
A typed, tree-shakable chart grammar for SVG and Canvas. Compose marks, views, scales, transforms, interactions, and motion with compact primitives or D3-compatible inputs.
JavaScript With Syntax For Types.
TypeScript extends JavaScript by adding types to the language. TypeScript speeds up your development experience by catching errors and providing fixes before you even run your code.
A Very Early History of Algebraic Data Types
Been quiet around here! I’ve been putting almost all of my writing time into Logic for Programmers and my whole brain is book-shaped. Trust me, you do not want to read my 2000-word rant on Sphinx post-build LaTeX customization. But I spent the past week in a historical rabbit hole and had to share what I found. It started with Algebraic [Data] Types are not Scary, Actually. The post covers AlgDTs1 in more detail, but a quick overview is:
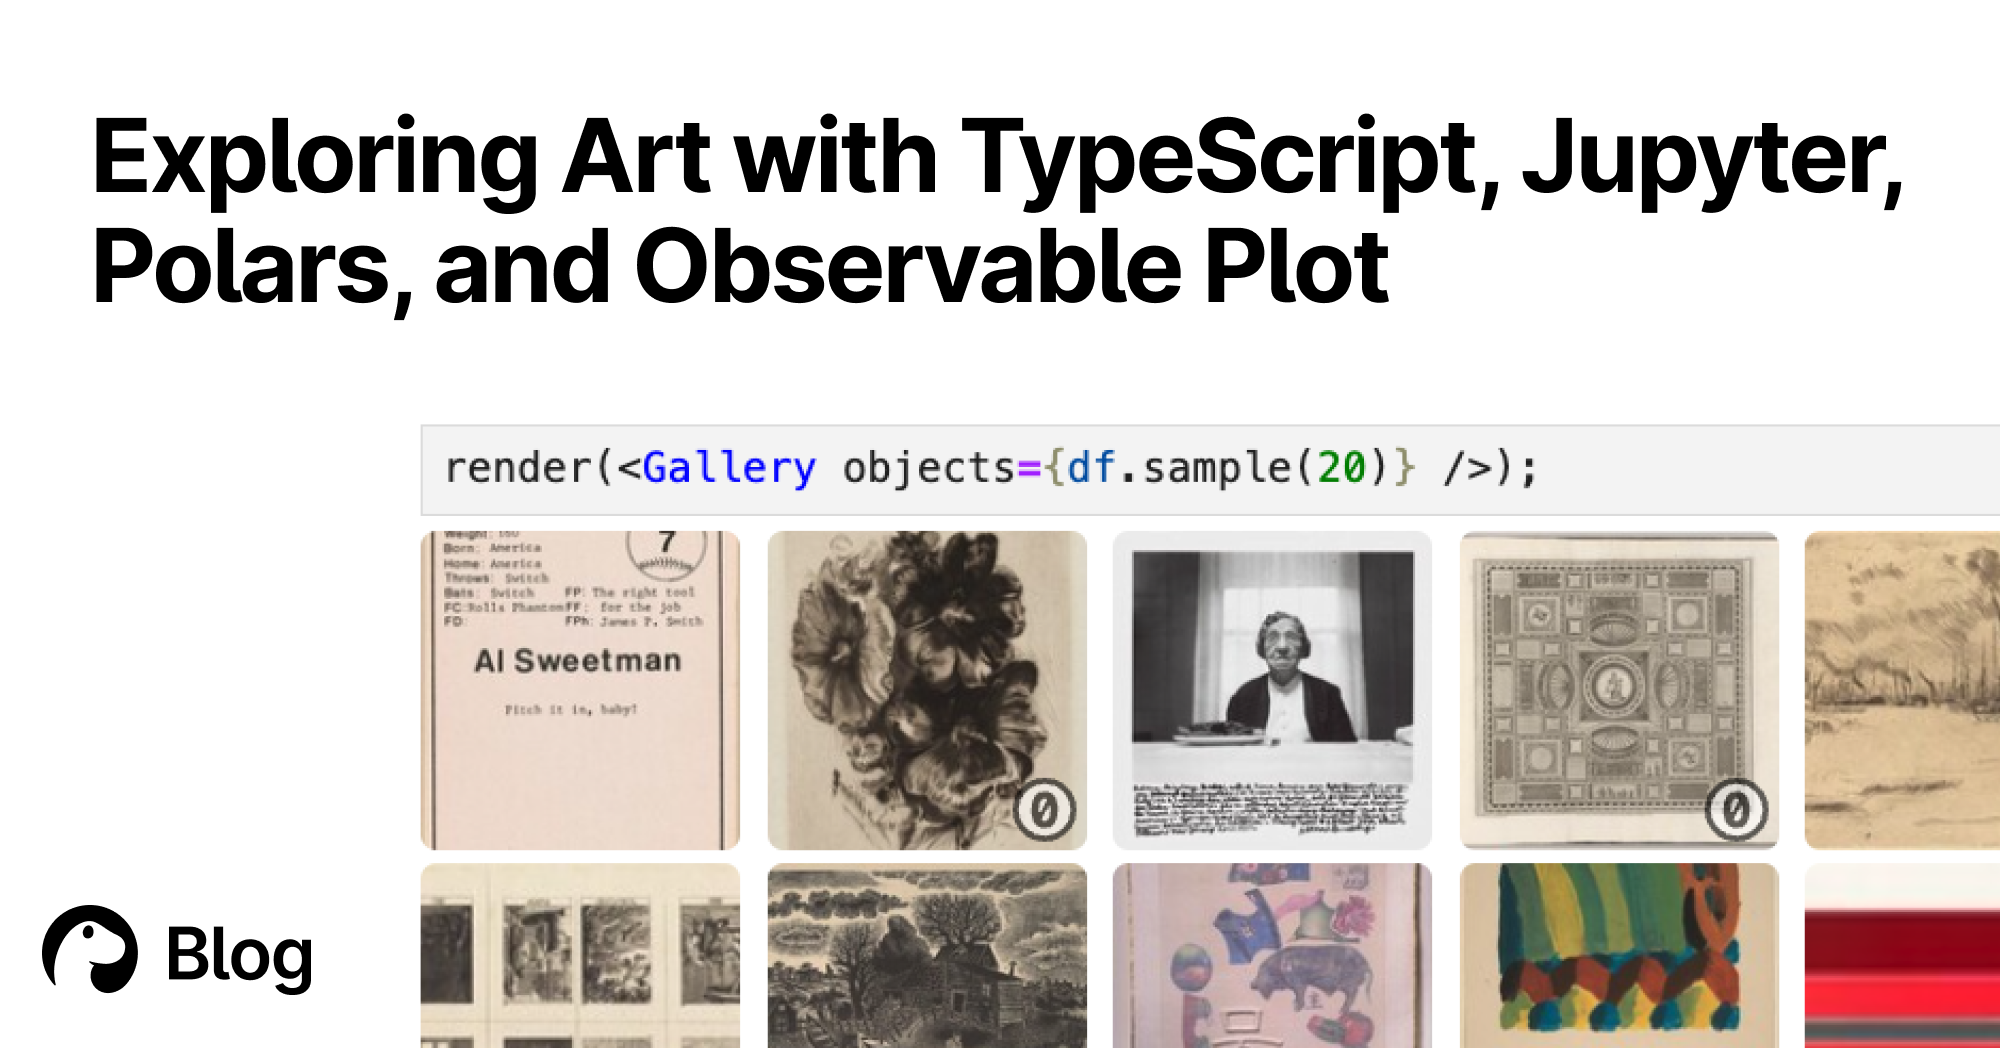
Exploring Art with TypeScript, Jupyter, Polars, and Observable Plot | Deno
With Deno's Jupyter support, you can explore, interact, and create interactive charts with TypeScript and HTML. Here's a tutorial featuring data of over 130,000 famous artworks.
Lini — diagrams, charts, drawings and schematics from plain text
Lini is a small text-to-diagram language: flowcharts, mindmaps, charts, sequence diagrams, ER schemas, engineering drawings, floor plans and circuit schematics from plain text, compiled to clean, themeable SVG. Open source, written in Rust, and it runs in the browser.
Datasette
Datasette is a tool for exploring and publishing data. It helps people take data of any shape, analyze and explore it, and publish it as an interactive website and accompanying API.

Timeless Type Family
Timeless Grotesk, Sans, Serif and Text — four variable typefaces with matching italics, free for personal and commercial use.

A High-Level Grammar of Interactive Graphics
Vega-Lite - a high-level grammar for statistical graphics. Vega-Lite provides a higher-level grammar for visual analysis, comparable to ggplot or Tableau, that generates complete Vega specifications. Vega-Lite specifications consist of simple mappings of variables in a data set to visual encoding channels such as x, y, color, and size. These mappings are then translated into detailed visualization specifications in the form of Vega specification language. Vega-Lite produces default values for visualization components (e.g., scales, axes, and legends) in the output Vega specification using a rule-based approach, but users can explicit specify these properties to override default values.
An Award-winning Data Visualization Designer
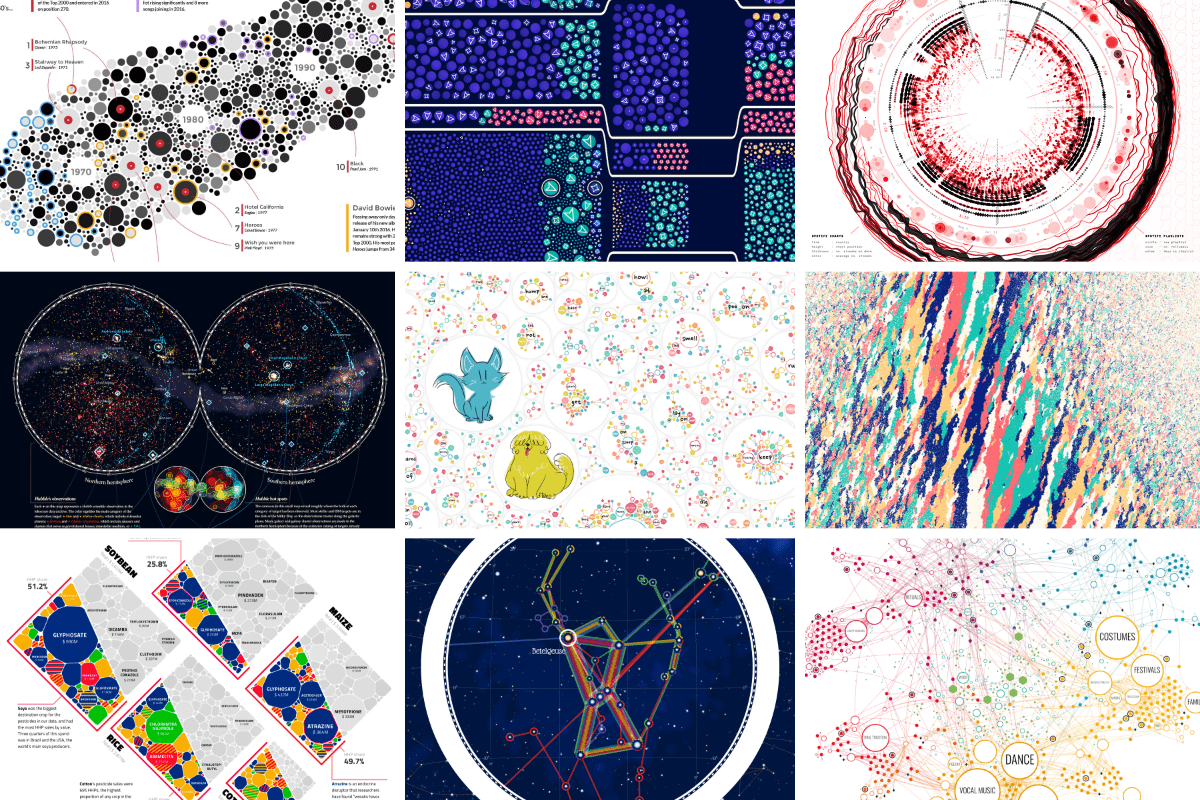
Visual Cinnamon | Data Visualization Design & Data Art | Data made insightful, effective & beautiful through data visualization and data art
The LaTeX Font Catalogue – Front Page
[Front Page] [Serif Fonts] [Serif Fonts, Sub-Categorised] [Sans Serif Fonts] [Typewriter Fonts] [Calligraphical and Handwritten Fonts] [Uncial Fonts] [Blackletter Fonts] [Other Fonts] [Fonts with Math Support] [Fonts with OpenType or TrueType Support] [All Fonts, by category] [All Fonts, alphabetically] [About The LaTeX Font Catalogue] [Packages that provide math support]
Really cool idea 🤯 - Install this web font - Just add plain text to the DOM - It renders a chart using font ligatures No JS, no hydration FOUC franktisellano.github.io/datatype/
