

A system for declaratively creating graphics, based on "The Grammar of Graphics". You provide the data, tell ggplot2 how to map variables to aesthetics, what graphical primitives to use, and it takes care of the details.
A High-Level Grammar of Interactive Graphics
Vega-Lite - a high-level grammar for statistical graphics. Vega-Lite provides a higher-level grammar for visual analysis, comparable to ggplot or Tableau, that generates complete Vega specifications. Vega-Lite specifications consist of simple mappings of variables in a data set to visual encoding channels such as x, y, color, and size. These mappings are then translated into detailed visualization specifications in the form of Vega specification language. Vega-Lite produces default values for visualization components (e.g., scales, axes, and legends) in the output Vega specification using a rule-based approach, but users can explicit specify these properties to override default values.
GitHub - observablehq/plot: A concise API for exploratory data visualization implementing a layered grammar of graphics
A concise API for exploratory data visualization implementing a layered grammar of graphics - observablehq/plot
ggtime: A Grammar of Temporal Graphics
Visualizing changes over time is fundamental to learning from the past and anticipating the future. However, temporal semantics can be complicated, and existing visualization tools often struggle to accurately represent these complexities. It is common to use bespoke plot helper functions designed to produce specific graphics, due to the absence of flexible general tools that respect temporal semantics. We address this problem by proposing a grammar of temporal graphics, and an associated software implementation, 'ggtime', that encodes temporal semantics into a declarative grammar for visualizing temporal data. The grammar introduces new composable elements that support visualization across linear, cyclical, quasi-cyclical, and other granularities; standardization of irregular durations; and alignment of time points across different granularities and time zones. It is designed for interoperability with other semantic variables, allowing navigation across the space of visualizations while preserving temporal semantics.

Home · Gadfly.jl
Gadfly is a system for plotting and visualization written in Julia. It is based largely on Hadley Wickhams's ggplot2 for R and Leland Wilkinson's book The Grammar of Graphics. It was Daniel C. Jones' brainchild and is now maintained by the community. Please consider citing it if you use it in your work.
ggsql: A grammar of graphics for SQL
Introducing ggsql, a grammar of graphics for SQL that lets you describe visualizations directly inside SQL queries.

The Grammar of Graphics
Preface to First Edition Before writing the graphics for SYSTAT in the 1980’s, I began by teaching a seminar in statistical graphics and collecting as many different quantitative graphics as I could find. I was determined to produce a package that could draw every statistical graphic I had ever seen. The structure of the program was a collection of procedures named after the basic graph types they p- duced. The graphics code was roughly one and a half megabytes in size. In the early 1990’s, I redesigned the SYSTAT graphics package using - ject-based technology. I intended to produce a more comprehensive and - namic package. I accomplished this by embedding graphical elements in a tree structure. Rendering graphics was done by walking the tree and editing worked by adding and deleting nodes. The code size fell to under a megabyte. In the late 1990’s, I collaborated with Dan Rope at the Bureau of Labor Statistics and Dan Carr at George Mason University to produce a graphics p- duction library called GPL, this time in Java. Our goal was to develop graphics components. This book was nourished by that project. So far, the GPL code size is under half a megabyte.

A checklist for designing and improving the visualization of scientific data
Creating clear and engaging scientific figures is crucial to communicate complex data. In this Comment, I condense principles from design, visual perception and data visualization research in a checklist that can help researchers to improve their data visualization, by focusing on clarity, accessibility and design best practices.
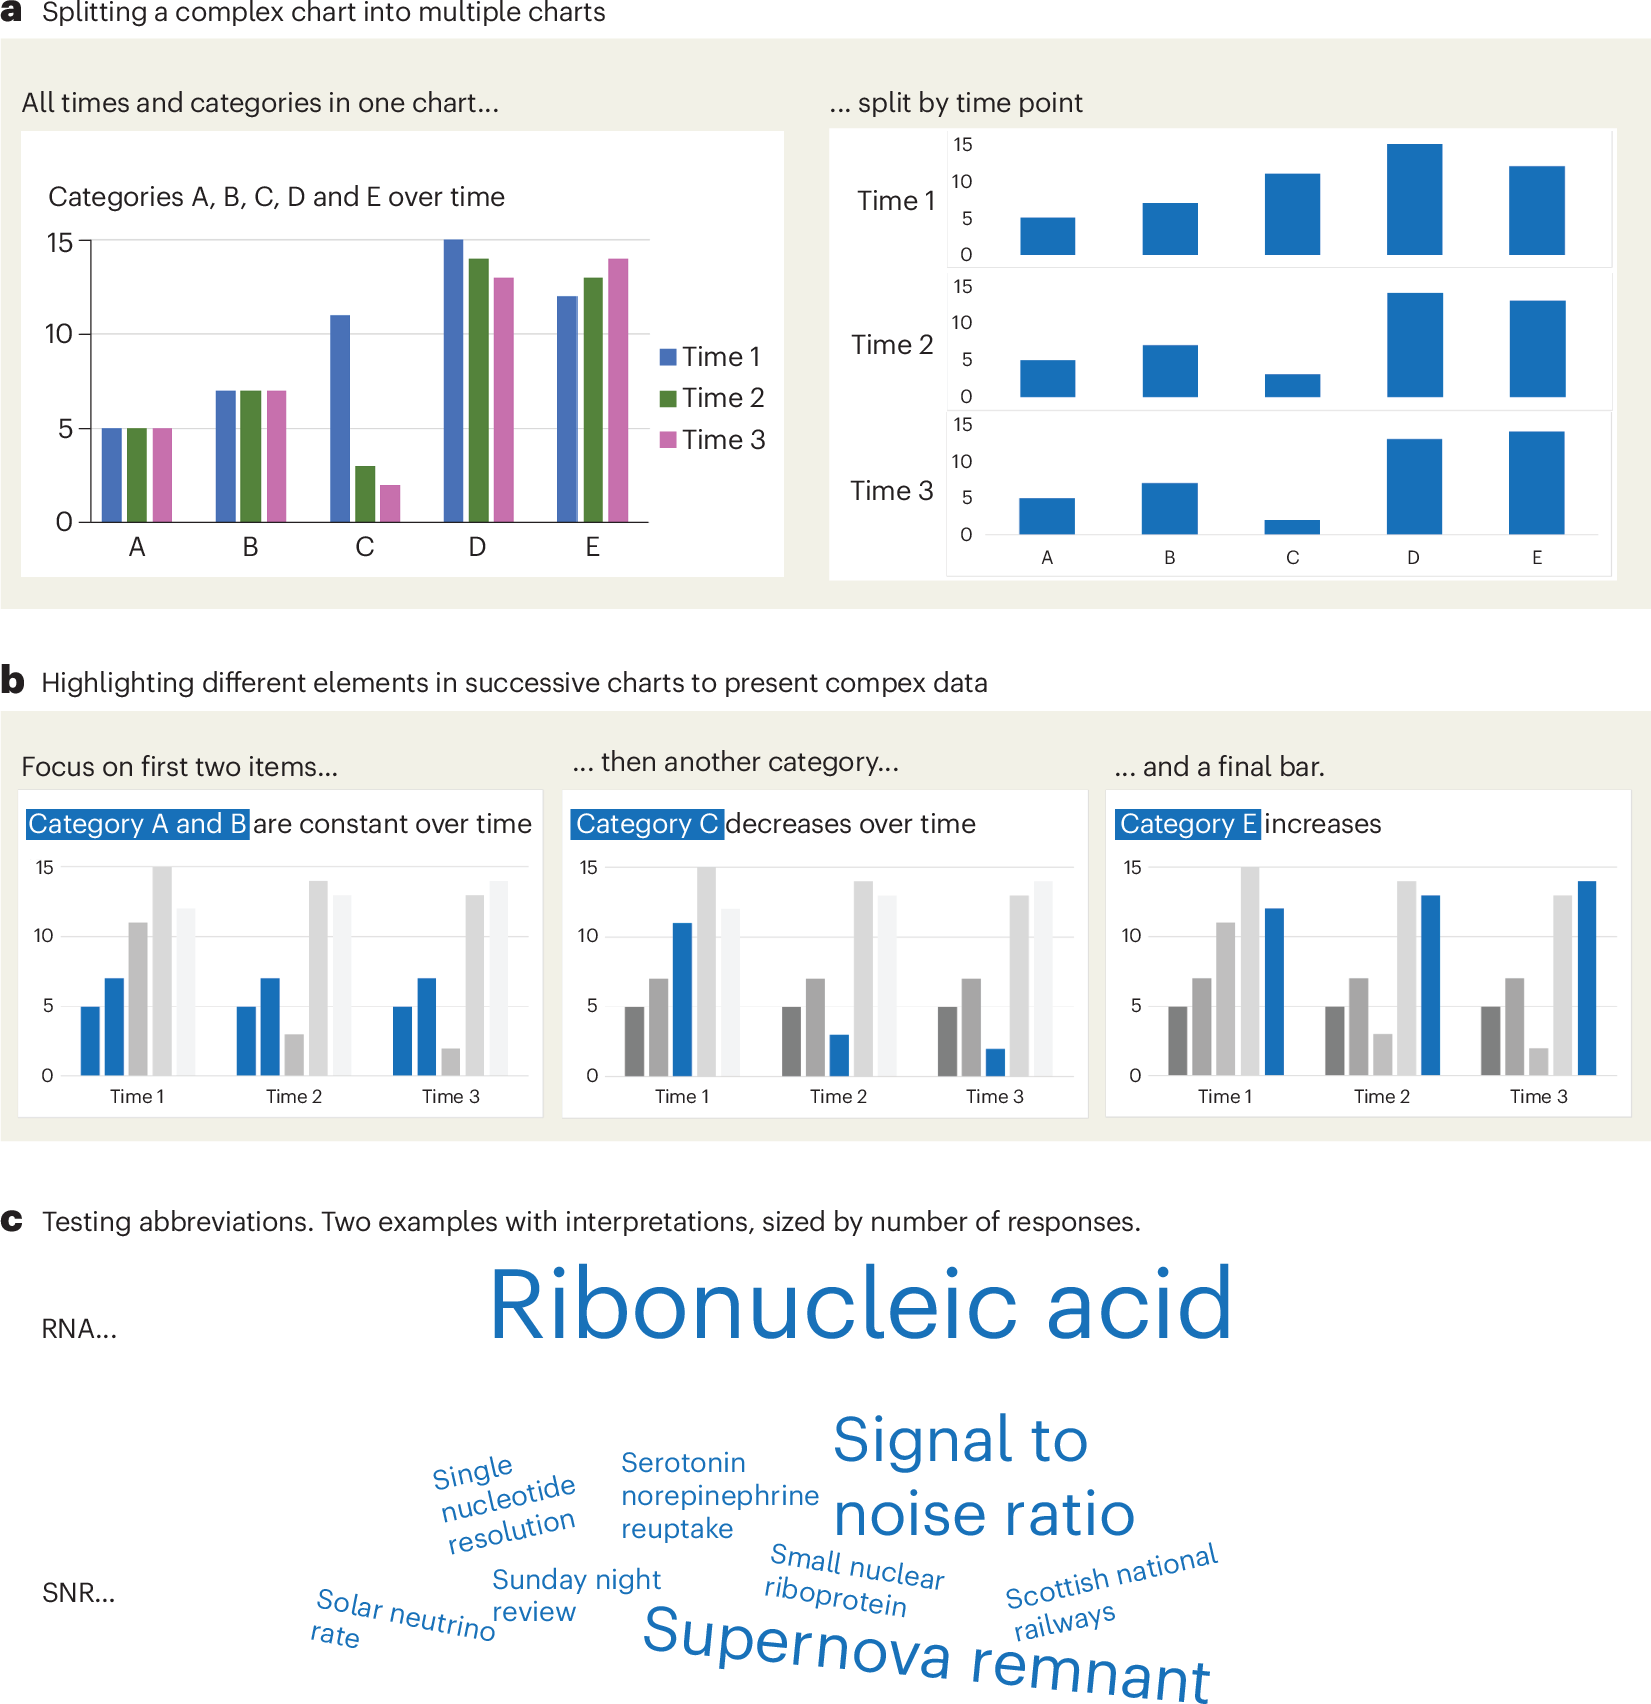
Chart Design Principles | Hands-On Data Visualization
Tell your story and show it with data, using free and easy-to-learn tools on the web. This introductory book teaches you how to design interactive charts and customized maps for your website, beginning with easy drag-and-drop tools, such as Google Sheets, Datawrapper, and Tableau Public. You will also gradually learn how to edit open-source code templates built with Chart.js, Highcharts, and Leaflet on GitHub. Follow along with the step-by-step tutorials, real-world examples, and online resources. This book is ideal for students, non-profit organizations, small business owners, local governments, journalists, academics, or anyone who wants to tell their story and show the data. No coding experience is required.
An Award-winning Data Visualization Designer
Visual Cinnamon | Data Visualization Design & Data Art | Data made insightful, effective & beautiful through data visualization and data art
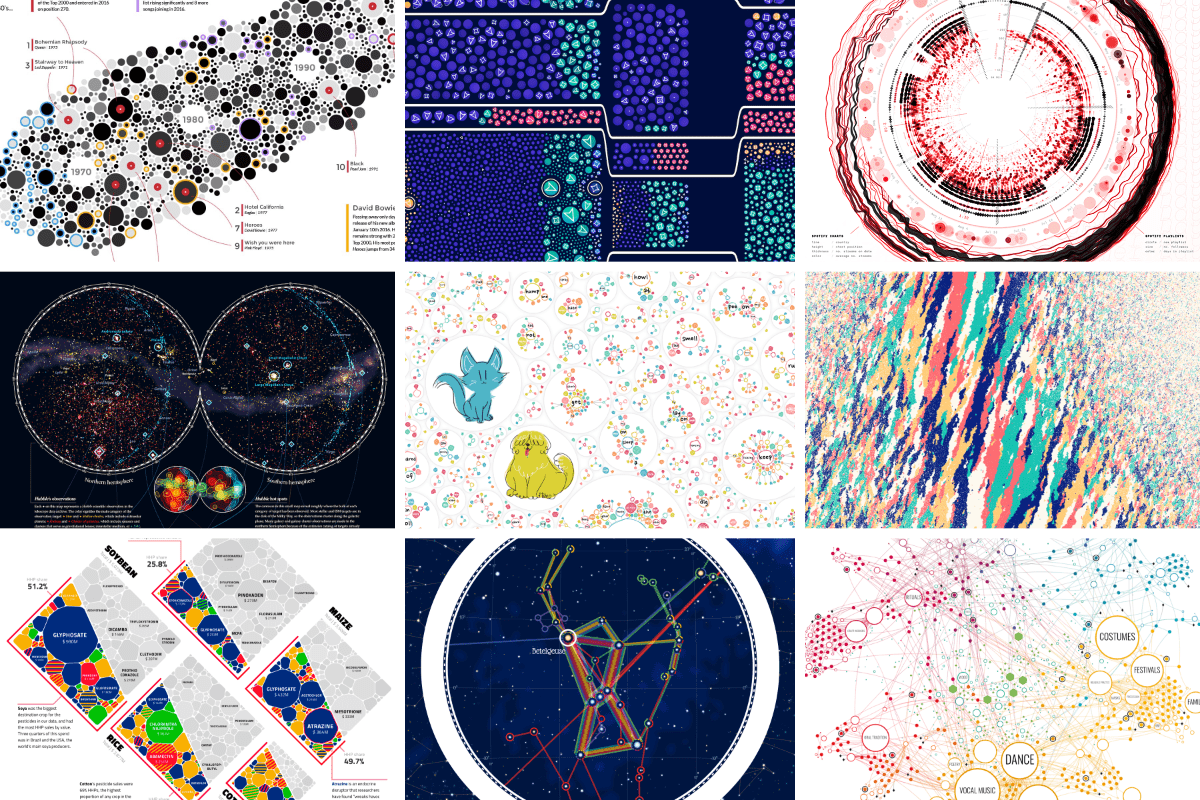
Cosmograph: Beautiful Visualization and Analytics | Cosmograph
Beautiful Visualization and Analytics

visualising data structures and algorithms through animation - VisuAlgo
VisuAlgo was conceptualised in 2011 by Associate Professor Steven Halim (NUS School of Computing) as a tool to help his students better understand data structures and algorithms, by allowing them to learn the basics on their own and at their own pace. Together with his students from the National University of Singapore, a series of visualizations were developed and consolidated, from simple sorting algorithms to complex graph data structures. Though specifically designed for the use of NUS students taking various data structure and algorithm classes (CS1010/equivalent, CS2040/equivalent (inclusive of IT5003)), CS3230, CS3233, and CS4234), as advocators of online learning, we hope that curious minds around the world will find these visualizations useful as well.
G6 Graph Visualization Framework in JavaScript
G6 is a graph visualization framework with simplicity and convenience. Based on the ability of customization, it provides elegant graph visualization solutions, helping developers build applications for graph visualization, analysis, and editing.

