

This PR addresses issue #31130 by replacing specific safe occurrences of np.column_stack with np.vstack().T for better performance. IMPORTANT: This is a more targeted fix than originally proposed. ...
An AI Agent Published a Hit Piece on Me
Scott Shambaugh helps maintain the excellent and venerable matplotlib Python charting library, including taking on the thankless task of triaging and reviewing incoming pull requests. A GitHub account called @crabby-rathbun …
Matplotlib: A 2D Graphics Environment
Matplotlib is a 2D graphics package used for Python for application development, interactive scripting,and publication-quality image generation across user interfaces and operating systems
12 Python Data Visualization Libraries to Explore for Business Analysis | Mode
This list is an overview of 10 interdisciplinary Python data visualization libraries including matplotlib, Seaborn, Plotly, Bokeh, pygal, geoplotlib, & more.
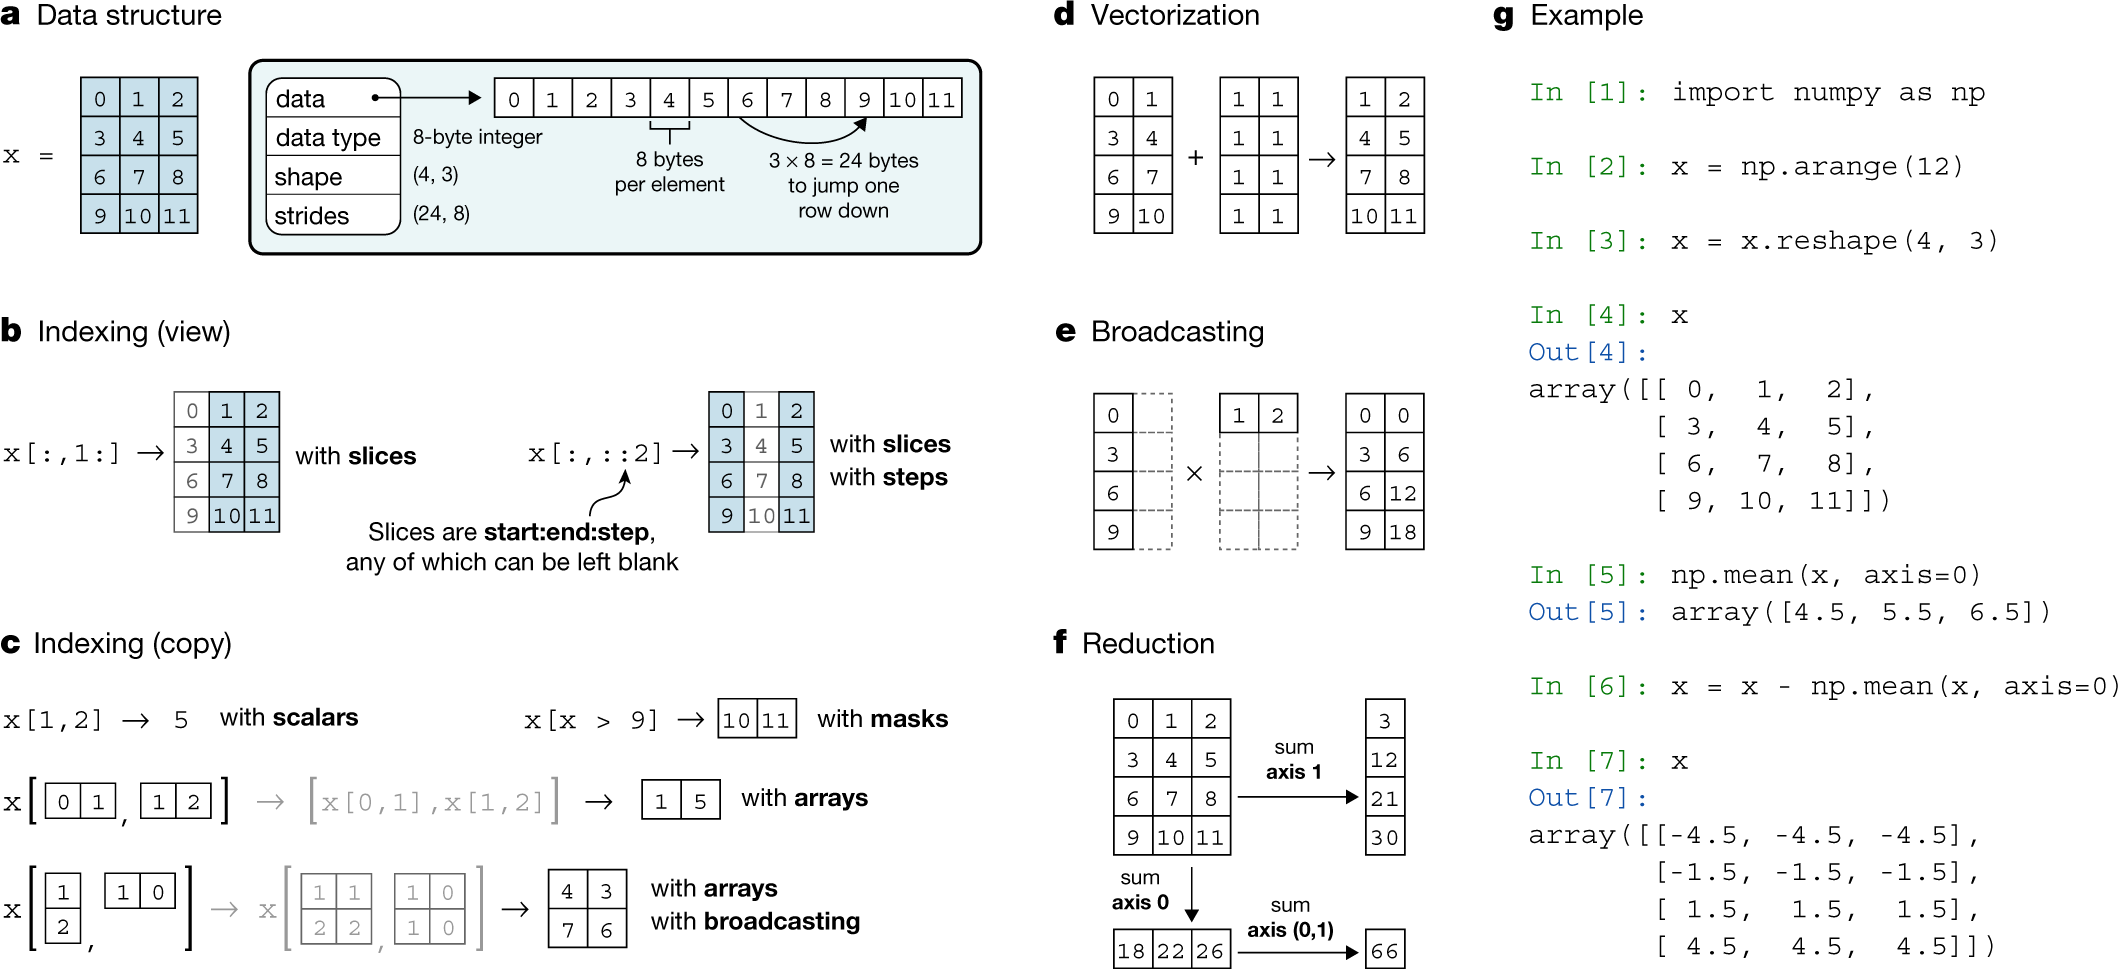
Array programming with NumPy
Array programming provides a powerful, compact and expressive syntax for accessing, manipulating and operating on data in vectors, matrices and higher-dimensional arrays. NumPy is the primary array programming library for the Python language. It has an essential role in research analysis pipelines in fields as diverse as physics, chemistry, astronomy, geoscience, biology, psychology, materials science, engineering, finance and economics. For example, in astronomy, NumPy was an important part of the software stack used in the discovery of gravitational waves1 and in the first imaging of a black hole2. Here we review how a few fundamental array concepts lead to a simple and powerful programming paradigm for organizing, exploring and analysing scientific data. NumPy is the foundation upon which the scientific Python ecosystem is constructed. It is so pervasive that several projects, targeting audiences with specialized needs, have developed their own NumPy-like interfaces and array objects. Owing to its central position in the ecosystem, NumPy increasingly acts as an interoperability layer between such array computation libraries and, together with its application programming interface (API), provides a flexible framework to support the next decade of scientific and industrial analysis.
Comparison of plotting packages
I want to write a small 2d physical simulation to sharpen my Julia skills and learn how to use Julia to display more than “regular plots” I saw a post suggesting using either Makie, Plots or Javis I don’t want to start a fan war but would appreciate a comparison of the different use cases where each of the packages shines and where it can be challenging to use

SciPy 1.0: fundamental algorithms for scientific computing in Python
SciPy is an open-source scientific computing library for the Python programming language. Since its initial release in 2001, SciPy has become a de facto standard for leveraging scientific algorithms in Python, with over 600 unique code contributors, thousands of dependent packages, over 100,000 dependent repositories and millions of downloads per year. In this work, we provide an overview of the capabilities and development practices of SciPy 1.0 and highlight some recent technical developments.

Exult
Since the 1.12.0 release we fixed some crashes and a plot stopping bug which warrant a hotfix release. Our new stable build has these fixes applied:
Exult
Since the 1.12.0 release we fixed some crashes and a plot stopping bug which warrant a hotfix release. Our new stable build has these fixes applied:
DSPy Notebook - Ax LLM Framework
Matrix Morpheus GIF - Matrix Morpheus Fighting - Discover & Share GIFs
Click to view the GIF

Hive Plots - Linear Layout for Network Visualization - Visually Interpreting Network Structure and Content Made Possible
the hive plot is a perceptually uniform and scalable linear layout visualization for network visual analytics
ci: mirror repo to tangled · npmx-dev/npmx.dev@93ddda3
resolves https://github.com/npmx-dev/npmx.dev/issues/459