

Redefined chart library built with React and D3
Learn to build unique charts with React
The React Graph Gallery displays hundreds of charts made with React, always with explanation and reproduciible code

jwilber/roughViz
Reusable JavaScript library for creating sketchy/hand-drawn styled charts in the browser.
chartgerink - Overview
chartgerink has 41 repositories available. Follow their code on GitHub.

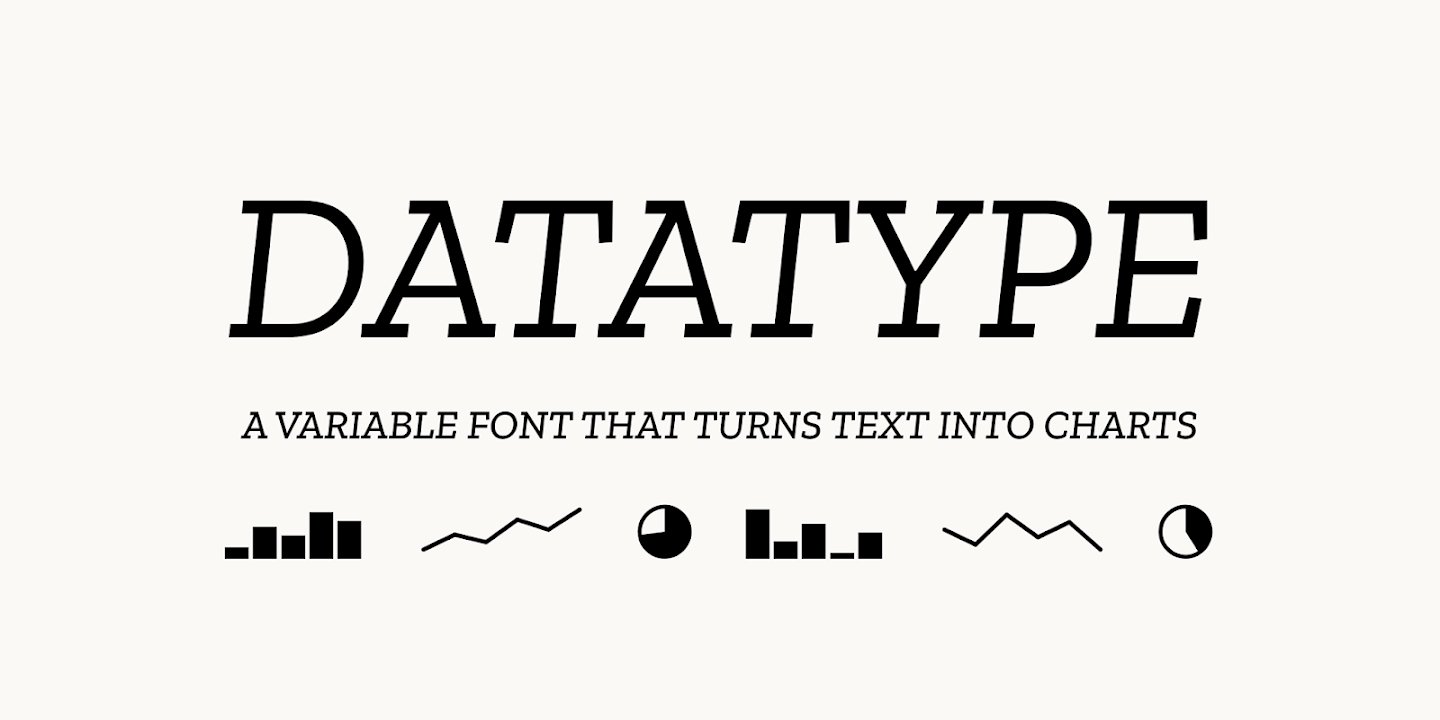
Meet Datatype, my new font that turns text into charts. Available on Google Fonts and of course in Workspace. Simple syntax like {b:10,25,7,95} turns into sparklines, pie charts, and bar charts that look great in your docs, slides, and sheets. https://t.co/0cgEkOcFfM https://t.co/wViF3fPtMr
Meet Datatype, my new font that turns text into charts. Available on Google Fonts and of course in Workspace.Simple syntax like {b:10,25,7,95} turns into sparklines, pie charts, and bar charts that look great in your docs, slides, and sheets.https://t.co/0cgEkOcFfM pic.twitter.com/wViF3fPtMr— Frank Tisellano (@franktisellano) March 12, 2026
ApexCharts Editor - Online Graph Maker
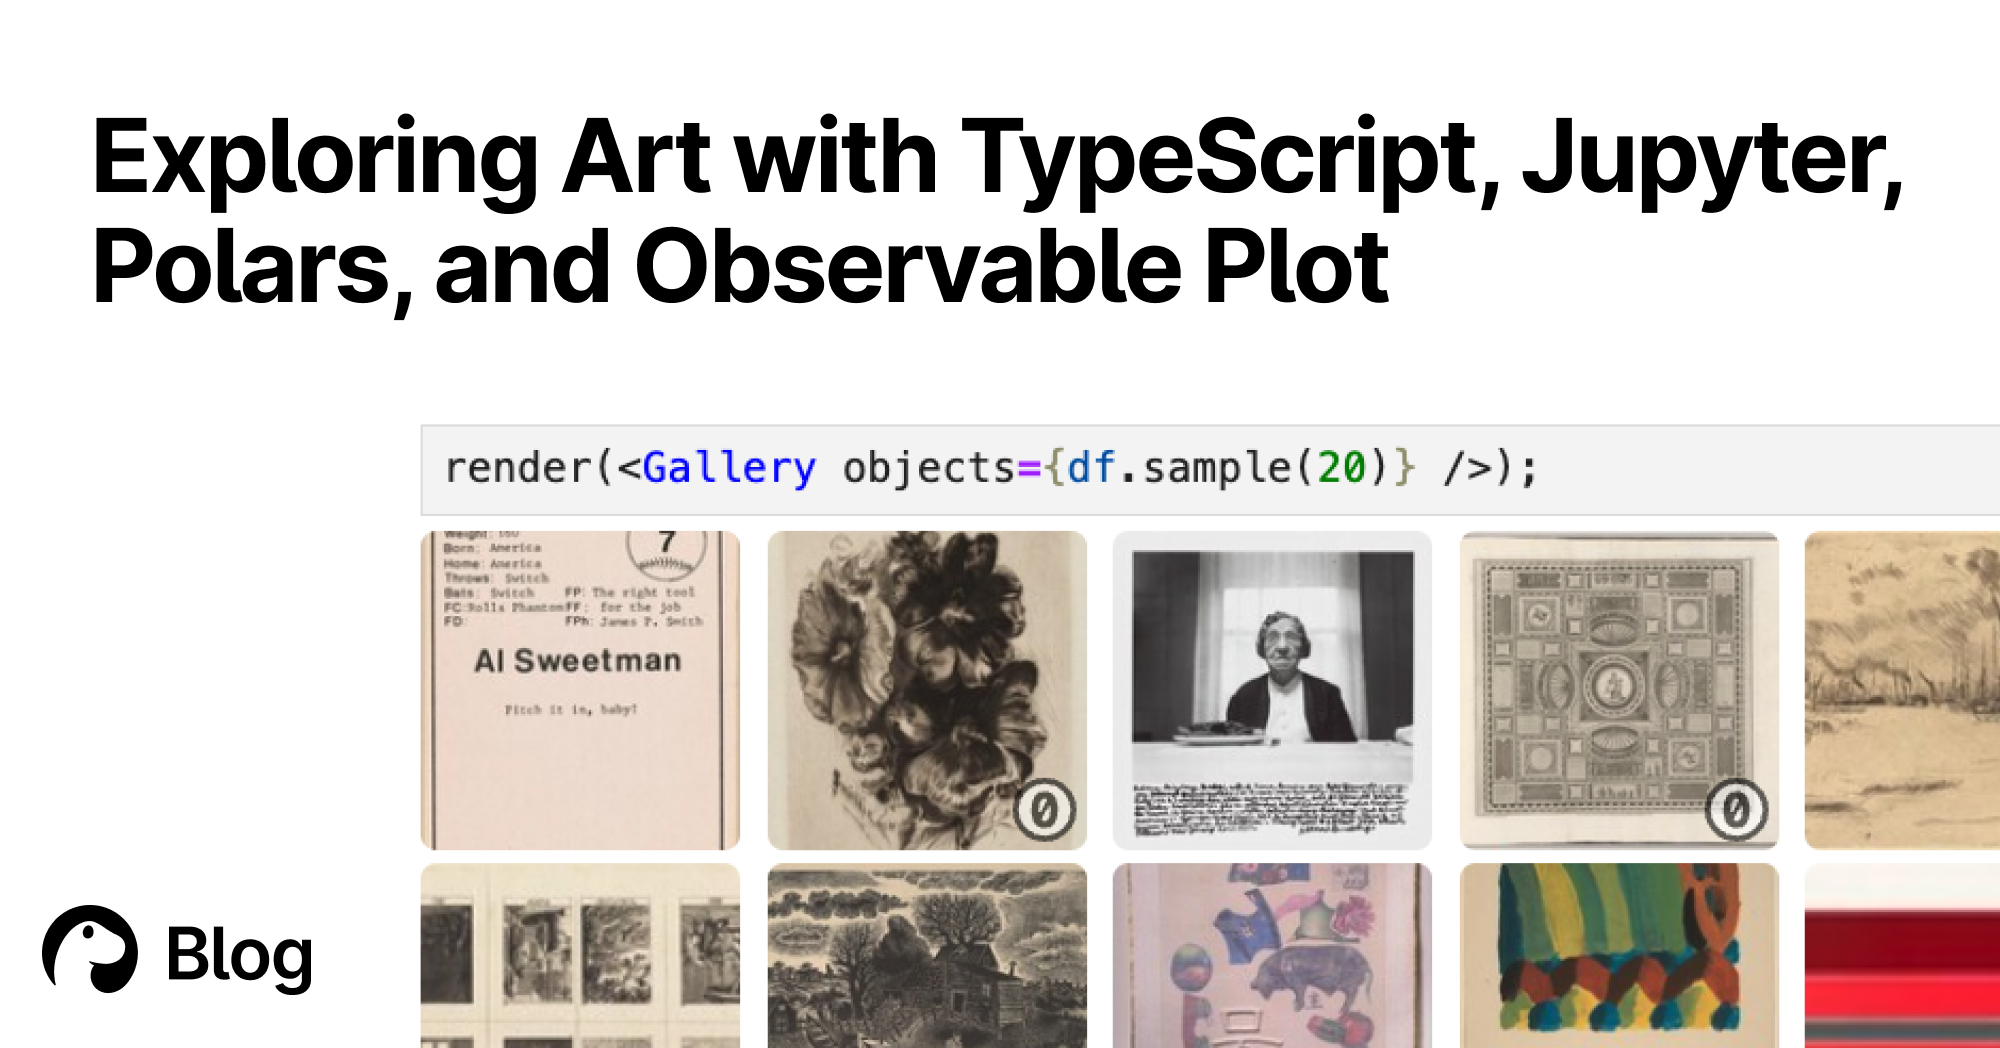
Exploring Art with TypeScript, Jupyter, Polars, and Observable Plot | Deno
With Deno's Jupyter support, you can explore, interact, and create interactive charts with TypeScript and HTML. Here's a tutorial featuring data of over 130,000 famous artworks.
kepano (@stephango.com)
This is Pele, my new rendering library for diagrams and charts, compatible with the latest Mermaid syntax. - 100-500× faster than mermaid.js - 6× smaller bundle - No dependencies - Easy to theme - Responsive to device width - Open source (MIT) Try it at pele.run

konvajs/react-konva
React components for the Konva 2d canvas library. Build interactive graphics, design editors, and whiteboards with JSX.
An AI Agent Published a Hit Piece on Me
Scott Shambaugh helps maintain the excellent and venerable matplotlib Python charting library, including taking on the thankless task of triaging and reviewing incoming pull requests. A GitHub account called @crabby-rathbun …
Chart Design Principles | Hands-On Data Visualization
Tell your story and show it with data, using free and easy-to-learn tools on the web. This introductory book teaches you how to design interactive charts and customized maps for your website, beginning with easy drag-and-drop tools, such as Google Sheets, Datawrapper, and Tableau Public. You will also gradually learn how to edit open-source code templates built with Chart.js, Highcharts, and Leaflet on GitHub. Follow along with the step-by-step tutorials, real-world examples, and online resources. This book is ideal for students, non-profit organizations, small business owners, local governments, journalists, academics, or anyone who wants to tell their story and show the data. No coding experience is required.
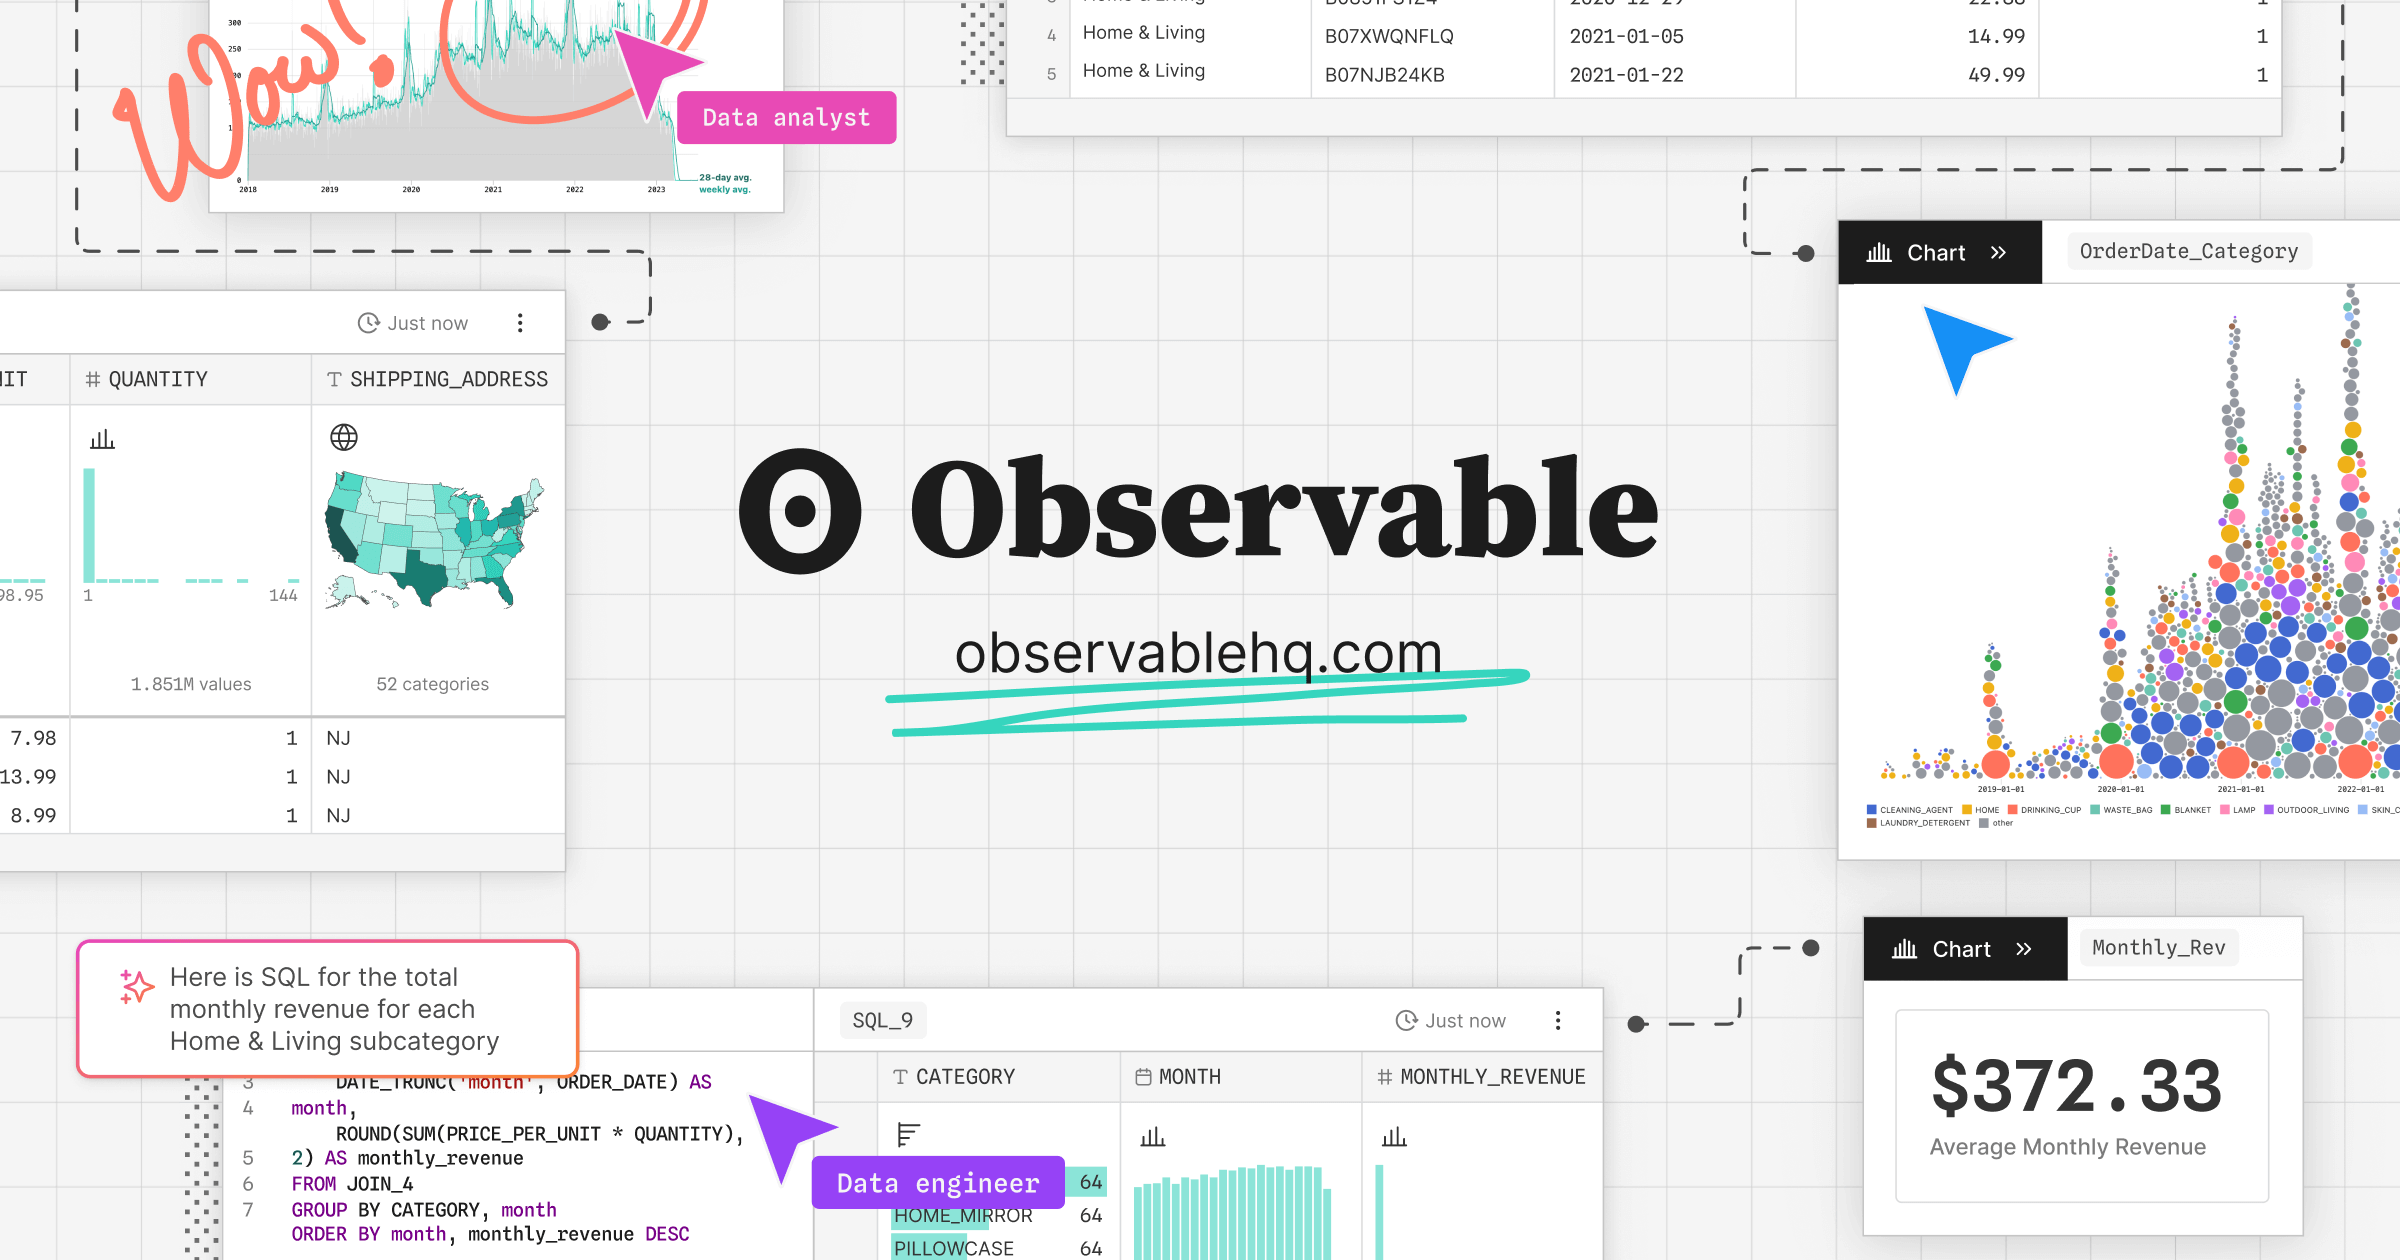
Observable Canvases | Explore and visualize data together
Observable’s collaborative data canvas helps you explore data, perform analysis, and build expressive charts and dashboards.
Really cool idea 🤯 - Install this web font - Just add plain text to the DOM - It renders a chart using font ligatures No JS, no hydration FOUC franktisellano.github.io/datatype/
