

A command line tool that draw plots on the terminal.
Terminal Graph — A spatial development environment for macOS
See everything. Switch nothing. Terminals, browsers, editors, and notes on one infinite canvas with dataflow connections. Native macOS.
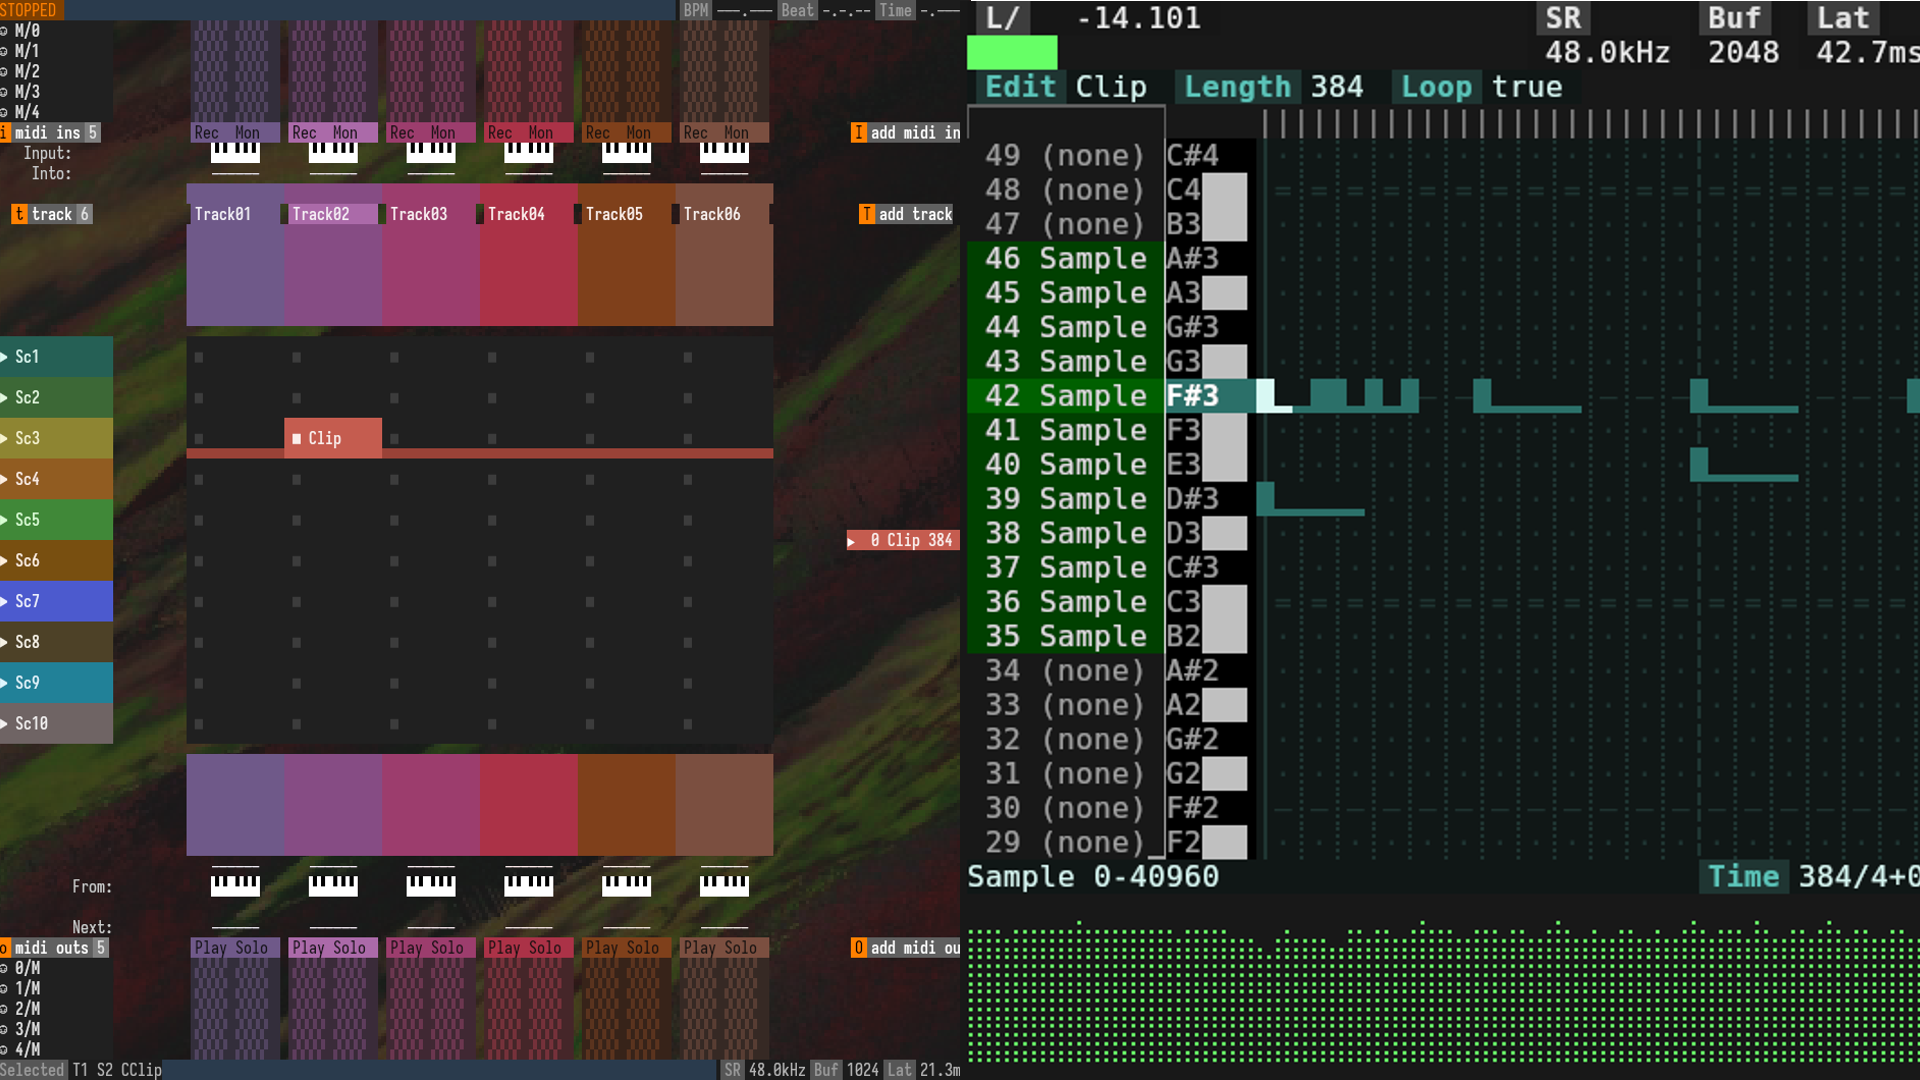
Terminal DAW Does It In Style
As any Linux chat room or forum will tell you, the most powerful tool to any Linux user is a terminal emulator. Just about every program under the sun has a command line alternative, be it CAD, not…
Documentation — Terminal Graph
Download Terminal Graph beta, learn the shortcuts, nodes, and dataflow model.
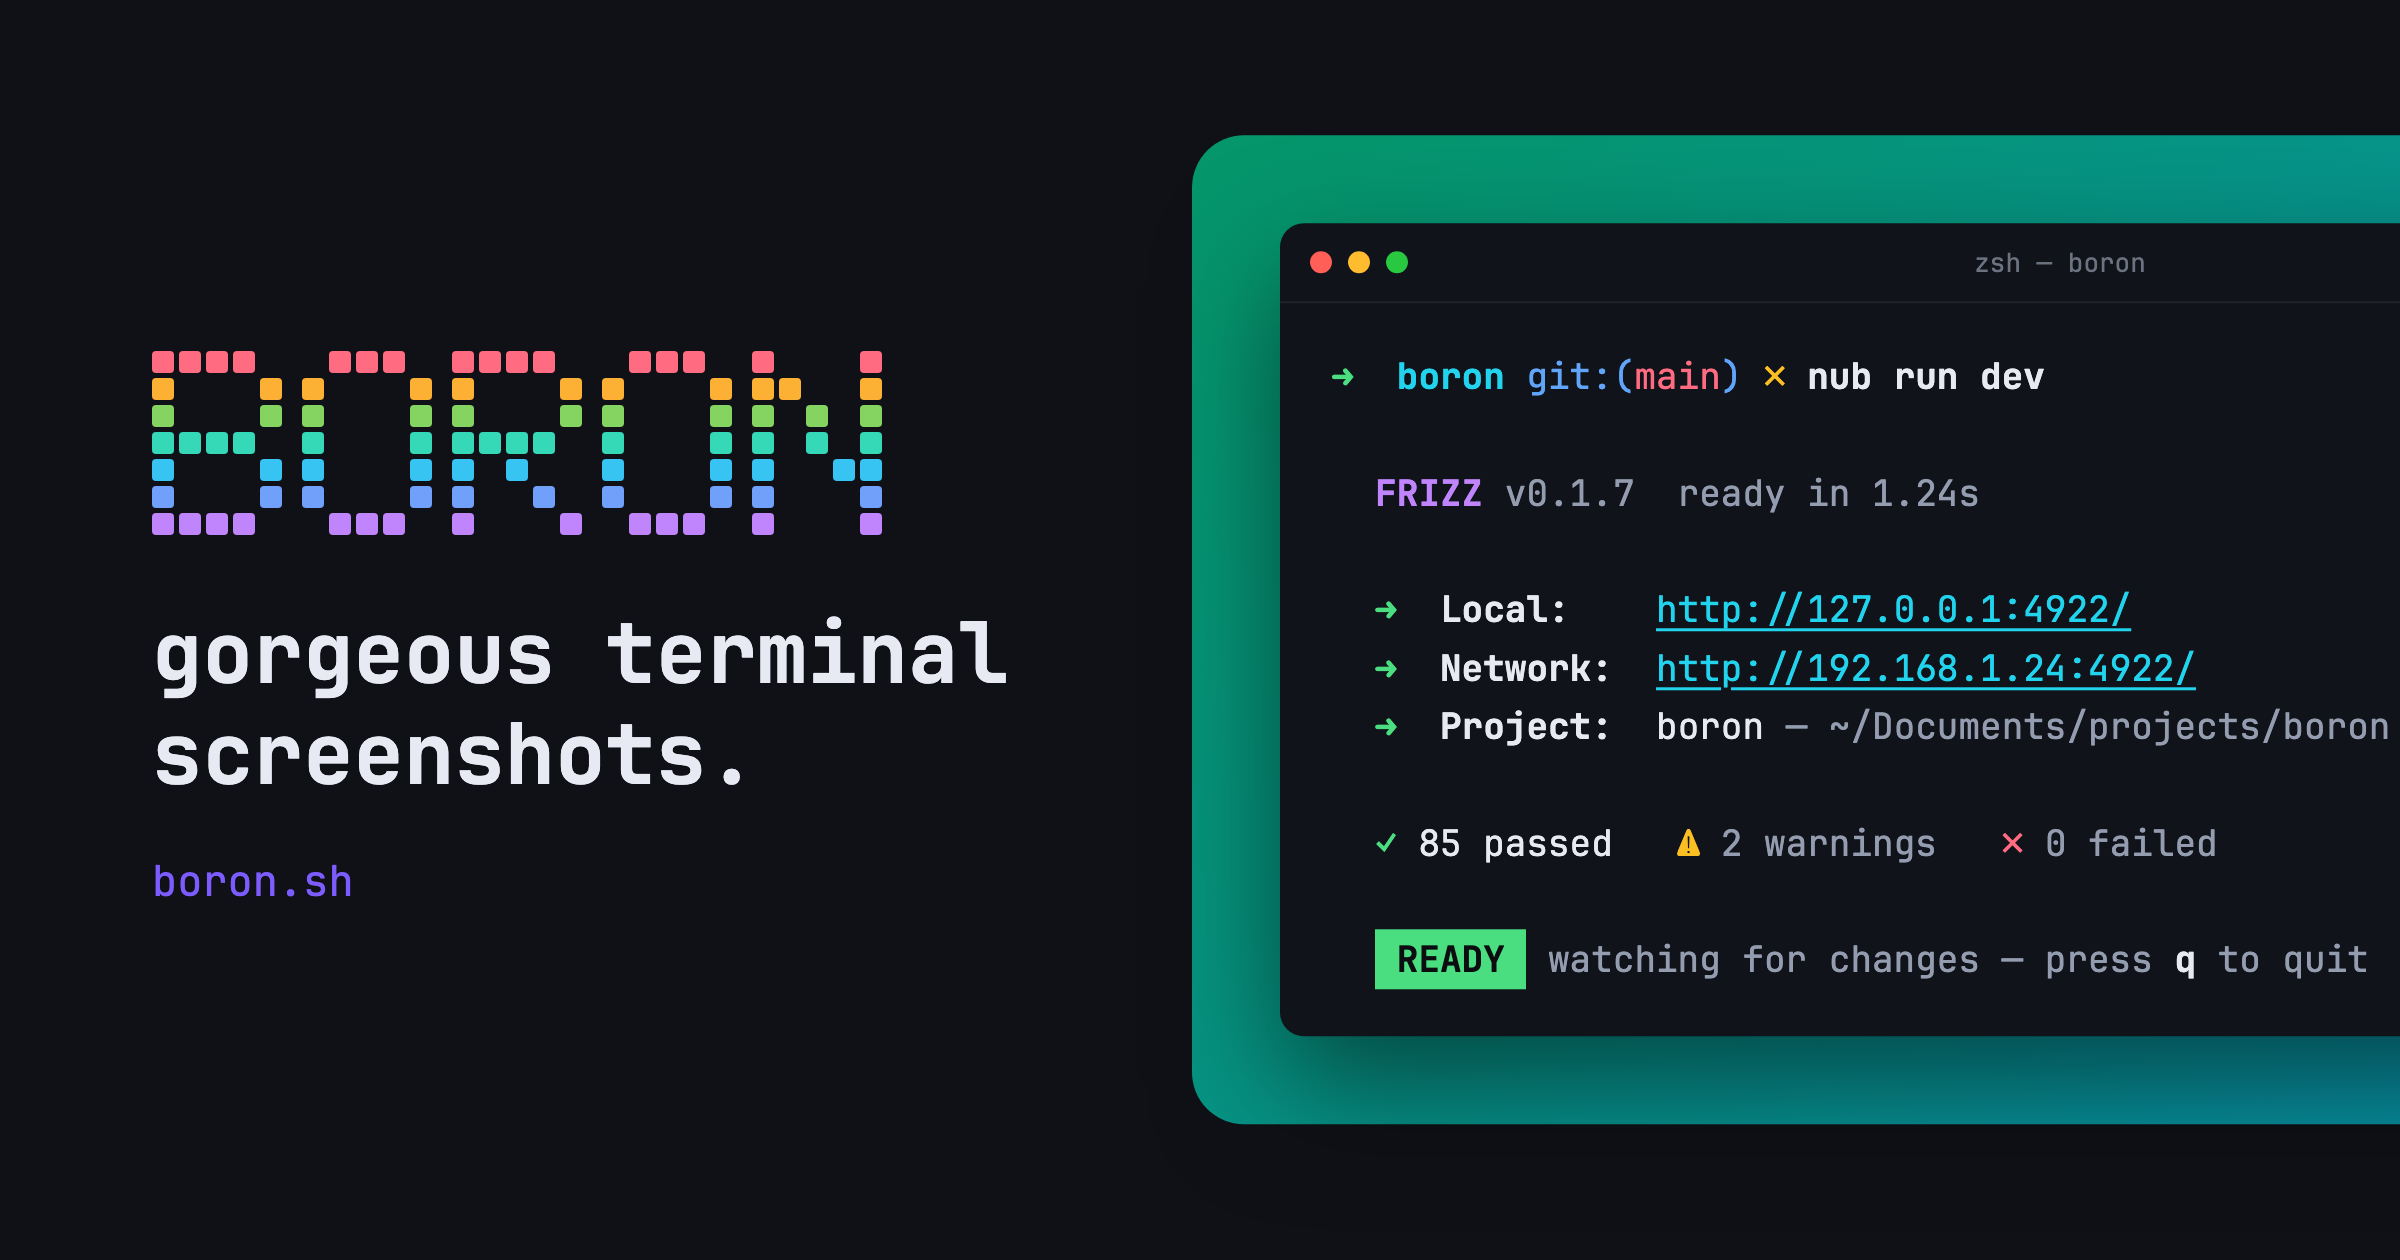
Boron — beautiful images of your terminal
Compose a terminal session, keep its ANSI colors, and export it as an image.
GitHub - observablehq/plot: A concise API for exploratory data visualization implementing a layered grammar of graphics
A concise API for exploratory data visualization implementing a layered grammar of graphics - observablehq/plot
Create Elegant Data Visualisations Using the Grammar of Graphics
A system for declaratively creating graphics, based on "The Grammar of Graphics". You provide the data, tell ggplot2 how to map variables to aesthetics, what graphical primitives to use, and it takes care of the details.
Terminal UI the Easy Way: BubbleTEA
For the past 18 months I've been tinkering with a terminal application that serves as an Algorand node frontend. I had a number of requireme...

An AI Agent Published a Hit Piece on Me
Scott Shambaugh helps maintain the excellent and venerable matplotlib Python charting library, including taking on the thankless task of triaging and reviewing incoming pull requests. A GitHub account called @crabby-rathbun …

12 Python Data Visualization Libraries to Explore for Business Analysis | Mode
This list is an overview of 10 interdisciplinary Python data visualization libraries including matplotlib, Seaborn, Plotly, Bokeh, pygal, geoplotlib, & more.
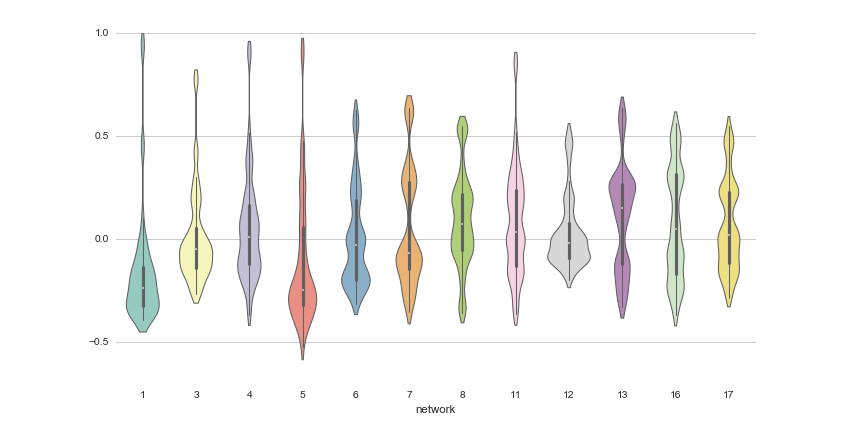
Matplotlib: A 2D Graphics Environment
Matplotlib is a 2D graphics package used for Python for application development, interactive scripting,and publication-quality image generation across user interfaces and operating systems
Lua Flot
The Flot JavaScript library does very nice plots which render in modern browsers with Canvas support. 'Flot' means 'pretty' or 'handsome' in Danish, and it definitely provides the cleanest most attractice results I've seen for browser-side plots.
A simple way of visualizing git repository
Some time ago, a new colleague joined our department and started working on a platform we provide. During his initial days, I noticed he was using an interactive Python shell to create treemap visualizations of the project's git history.
It's the update you've all been waiting for! This marks a major milestone for Terminal Graph. I'm excited to see what you all build, please share your creations with the world (and tag me)! You can download it at terminalgraph.com

Caidan
All of the pieces are finally starting to come together! This is the level of composability I had first imagined for terminal graph. Update coming soon!
Terminal toolbox

A collection of terminal tools and resources for Linux that I’ve found useful/fun or are my favourites!
am2rican5/sigye
beeb/swpui
jdefrancesco/dskDitto
Elsa002/queercat
GitHub - InputUsername/rescrobbled: MPRIS music scrobbler daemon
jj-vcs/jj