

Print data in formatted tables.
stargazer: Well-Formatted Regression and Summary Statistics Tables
Produces LaTeX code, HTML/CSS code and ASCII text for well-formatted tables that hold regression analysis results from several models side-by-side, as well as summary statistics.

Clear Off the Table - Darkhorse Visualization - Blog
Make dense data tables readable—remove clutter, align to a grid, and let the numbers speak.

The Frankenstein Table | CSS-Tricks
A super scary way to go about tables using other layout techniques, like CSS Grid.

Using jq to format JSON on the clipboard
Jq is a great tool. I use it frequently, but this recent article from Sequoia McDowell still has some great tips in it. Well worth a read. One thing that stood out to me from this post was the snippet
Tabula: Extract Tables from PDFs
Tabula is a free tool for extracting data from PDF files into CSV and Excel files.
Styling Tables the Modern CSS Way
Modern CSS makes styling HTML tables in a considered, responsive nature a breeze. Michelle Barker breaks it all down for you in this deep dive.
Times Tables — Learn, Play and Print the Multiplication Tables
Practise every times table from 1 to 12 with free games, speed tests, printable charts and worksheets. Works on phones, tablets and computers. No sign-up.

shshemi/tabiew
A lightweight TUI application to view and query tabular data files, such as CSV, TSV, and parquet.
JSON Formatter & Validator
Format and validate JSON data so that it can easily be read by human beings.

Teaching Data Science by Visualizing Data Table Transformations: Pandas Tutor for Python, Tidy Data Tutor for R, and SQL Tutor
As part of the Digital Library's transition to Open Access, new features for researchers are available in the Premium Edition. Click here to learn more.
j4ck.xyz/bsky-md
An API you can curl, or open in a browser, to receive Bluesky data as markdown!
Meet Datatype, my new font that turns text into charts. Available on Google Fonts and of course in Workspace. Simple syntax like {b:10,25,7,95} turns into sparklines, pie charts, and bar charts that look great in your docs, slides, and sheets. https://t.co/0cgEkOcFfM https://t.co/wViF3fPtMr
Meet Datatype, my new font that turns text into charts. Available on Google Fonts and of course in Workspace.Simple syntax like {b:10,25,7,95} turns into sparklines, pie charts, and bar charts that look great in your docs, slides, and sheets.https://t.co/0cgEkOcFfM pic.twitter.com/wViF3fPtMr— Frank Tisellano (@franktisellano) March 12, 2026
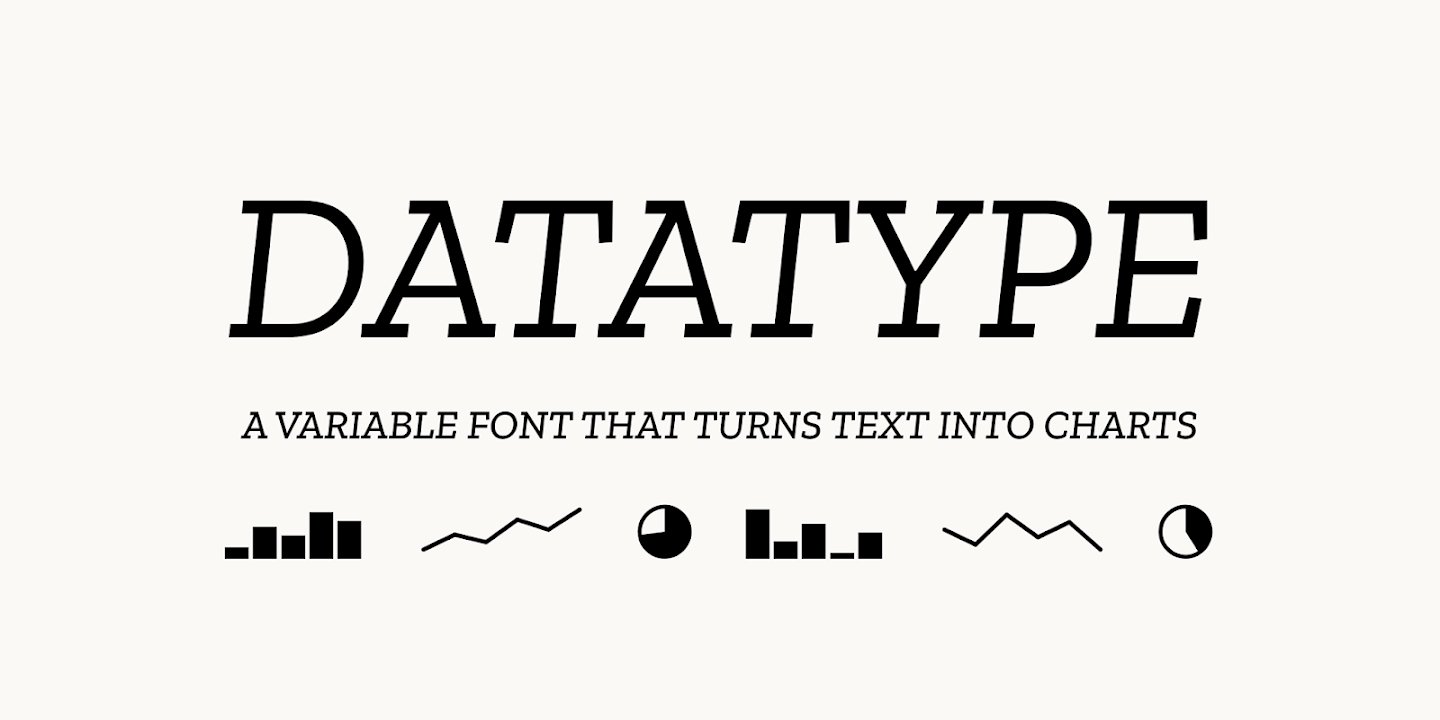
Chart Design Principles | Hands-On Data Visualization
Tell your story and show it with data, using free and easy-to-learn tools on the web. This introductory book teaches you how to design interactive charts and customized maps for your website, beginning with easy drag-and-drop tools, such as Google Sheets, Datawrapper, and Tableau Public. You will also gradually learn how to edit open-source code templates built with Chart.js, Highcharts, and Leaflet on GitHub. Follow along with the step-by-step tutorials, real-world examples, and online resources. This book is ideal for students, non-profit organizations, small business owners, local governments, journalists, academics, or anyone who wants to tell their story and show the data. No coding experience is required.
SCRAPING AND CLEANING YOUR DATA WITH GOOGLE SHEETS: A CLOSER LOOK
GOOGLE GUARANTEED - Ever found yourself copy and pasting data, wishing there was an easier way? Take a foray into the world of data scraping using Google Sheets with Jeremy Gottlieb!

Really cool idea 🤯 - Install this web font - Just add plain text to the DOM - It renders a chart using font ligatures No JS, no hydration FOUC franktisellano.github.io/datatype/
