

Performant financial charts built with HTML5 canvas
Chart Design Principles | Hands-On Data Visualization
Tell your story and show it with data, using free and easy-to-learn tools on the web. This introductory book teaches you how to design interactive charts and customized maps for your website, beginning with easy drag-and-drop tools, such as Google Sheets, Datawrapper, and Tableau Public. You will also gradually learn how to edit open-source code templates built with Chart.js, Highcharts, and Leaflet on GitHub. Follow along with the step-by-step tutorials, real-world examples, and online resources. This book is ideal for students, non-profit organizations, small business owners, local governments, journalists, academics, or anyone who wants to tell their story and show the data. No coding experience is required.
TradingView — Track All Markets
Where the world charts, chats, and trades markets. We're a supercharged super-charting platform and social network for traders and investors. Free to sign up.

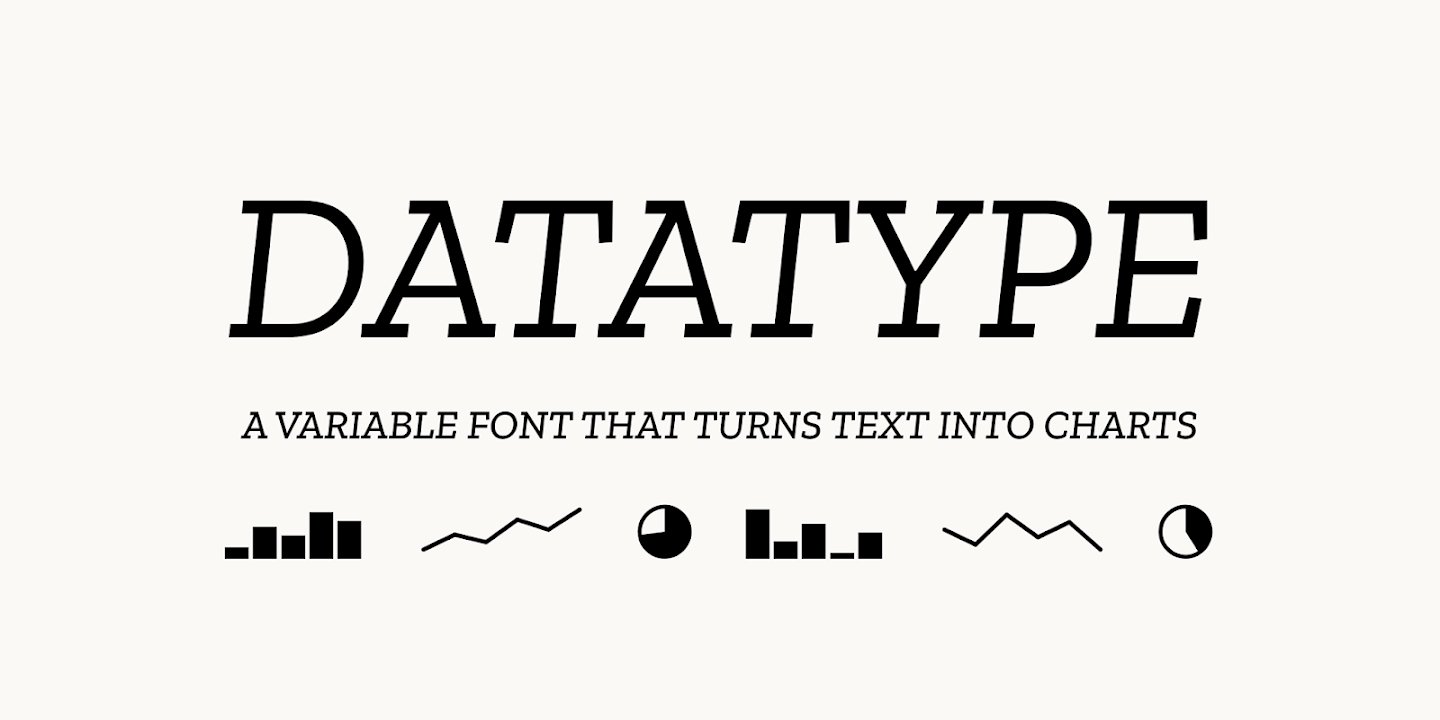
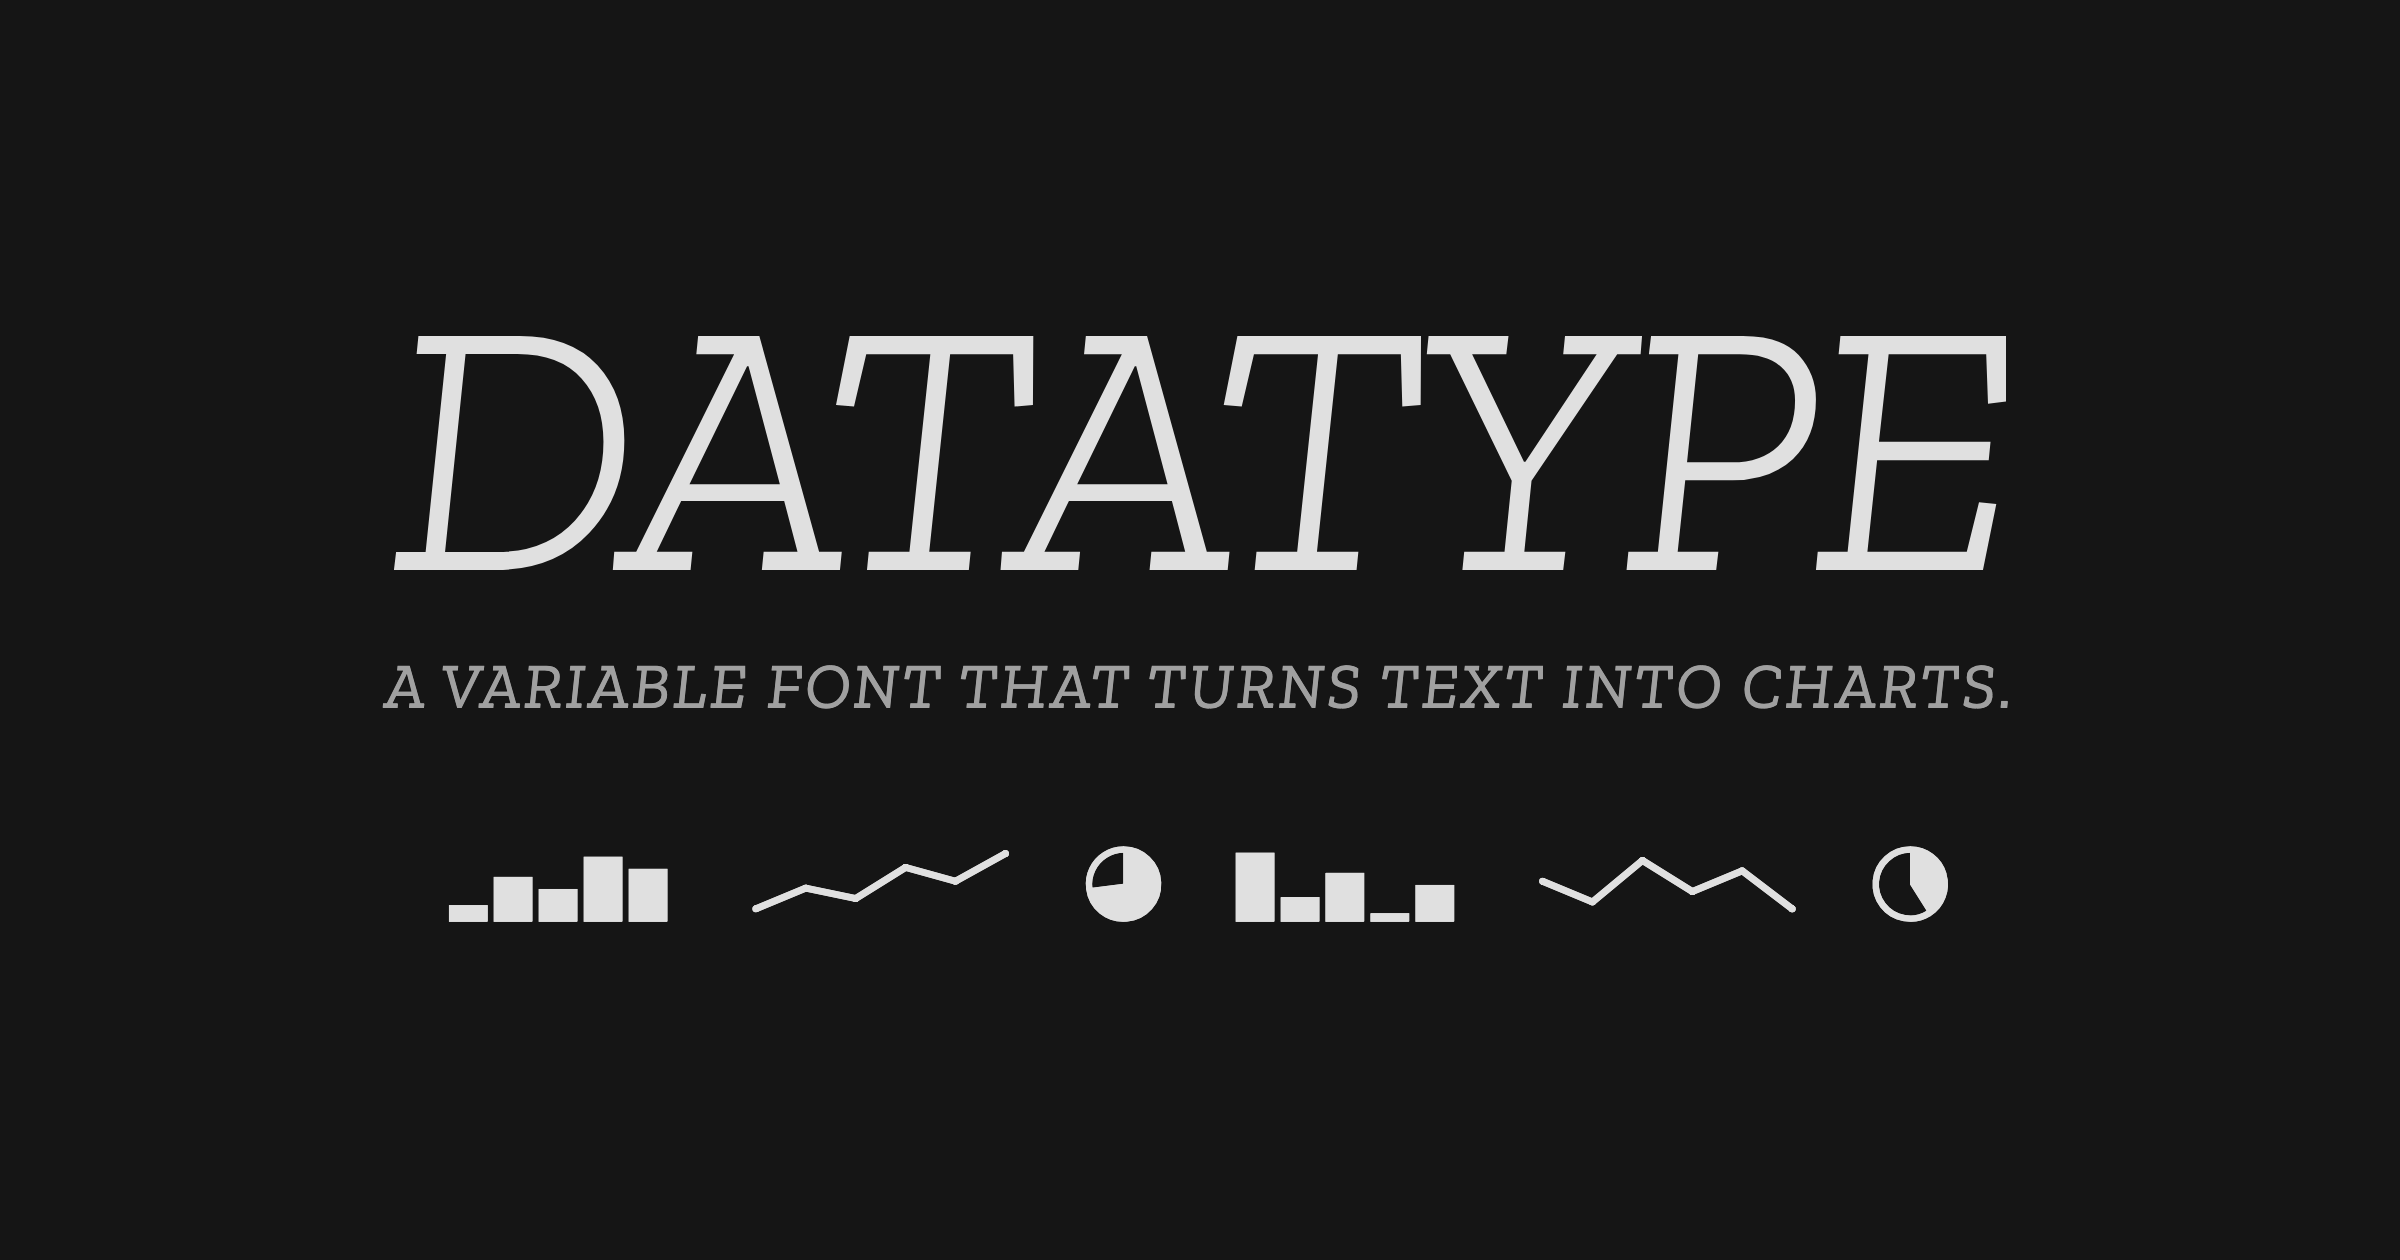
Meet Datatype, my new font that turns text into charts. Available on Google Fonts and of course in Workspace. Simple syntax like {b:10,25,7,95} turns into sparklines, pie charts, and bar charts that look great in your docs, slides, and sheets. https://t.co/0cgEkOcFfM https://t.co/wViF3fPtMr
Meet Datatype, my new font that turns text into charts. Available on Google Fonts and of course in Workspace.Simple syntax like {b:10,25,7,95} turns into sparklines, pie charts, and bar charts that look great in your docs, slides, and sheets.https://t.co/0cgEkOcFfM pic.twitter.com/wViF3fPtMr— Frank Tisellano (@franktisellano) March 12, 2026
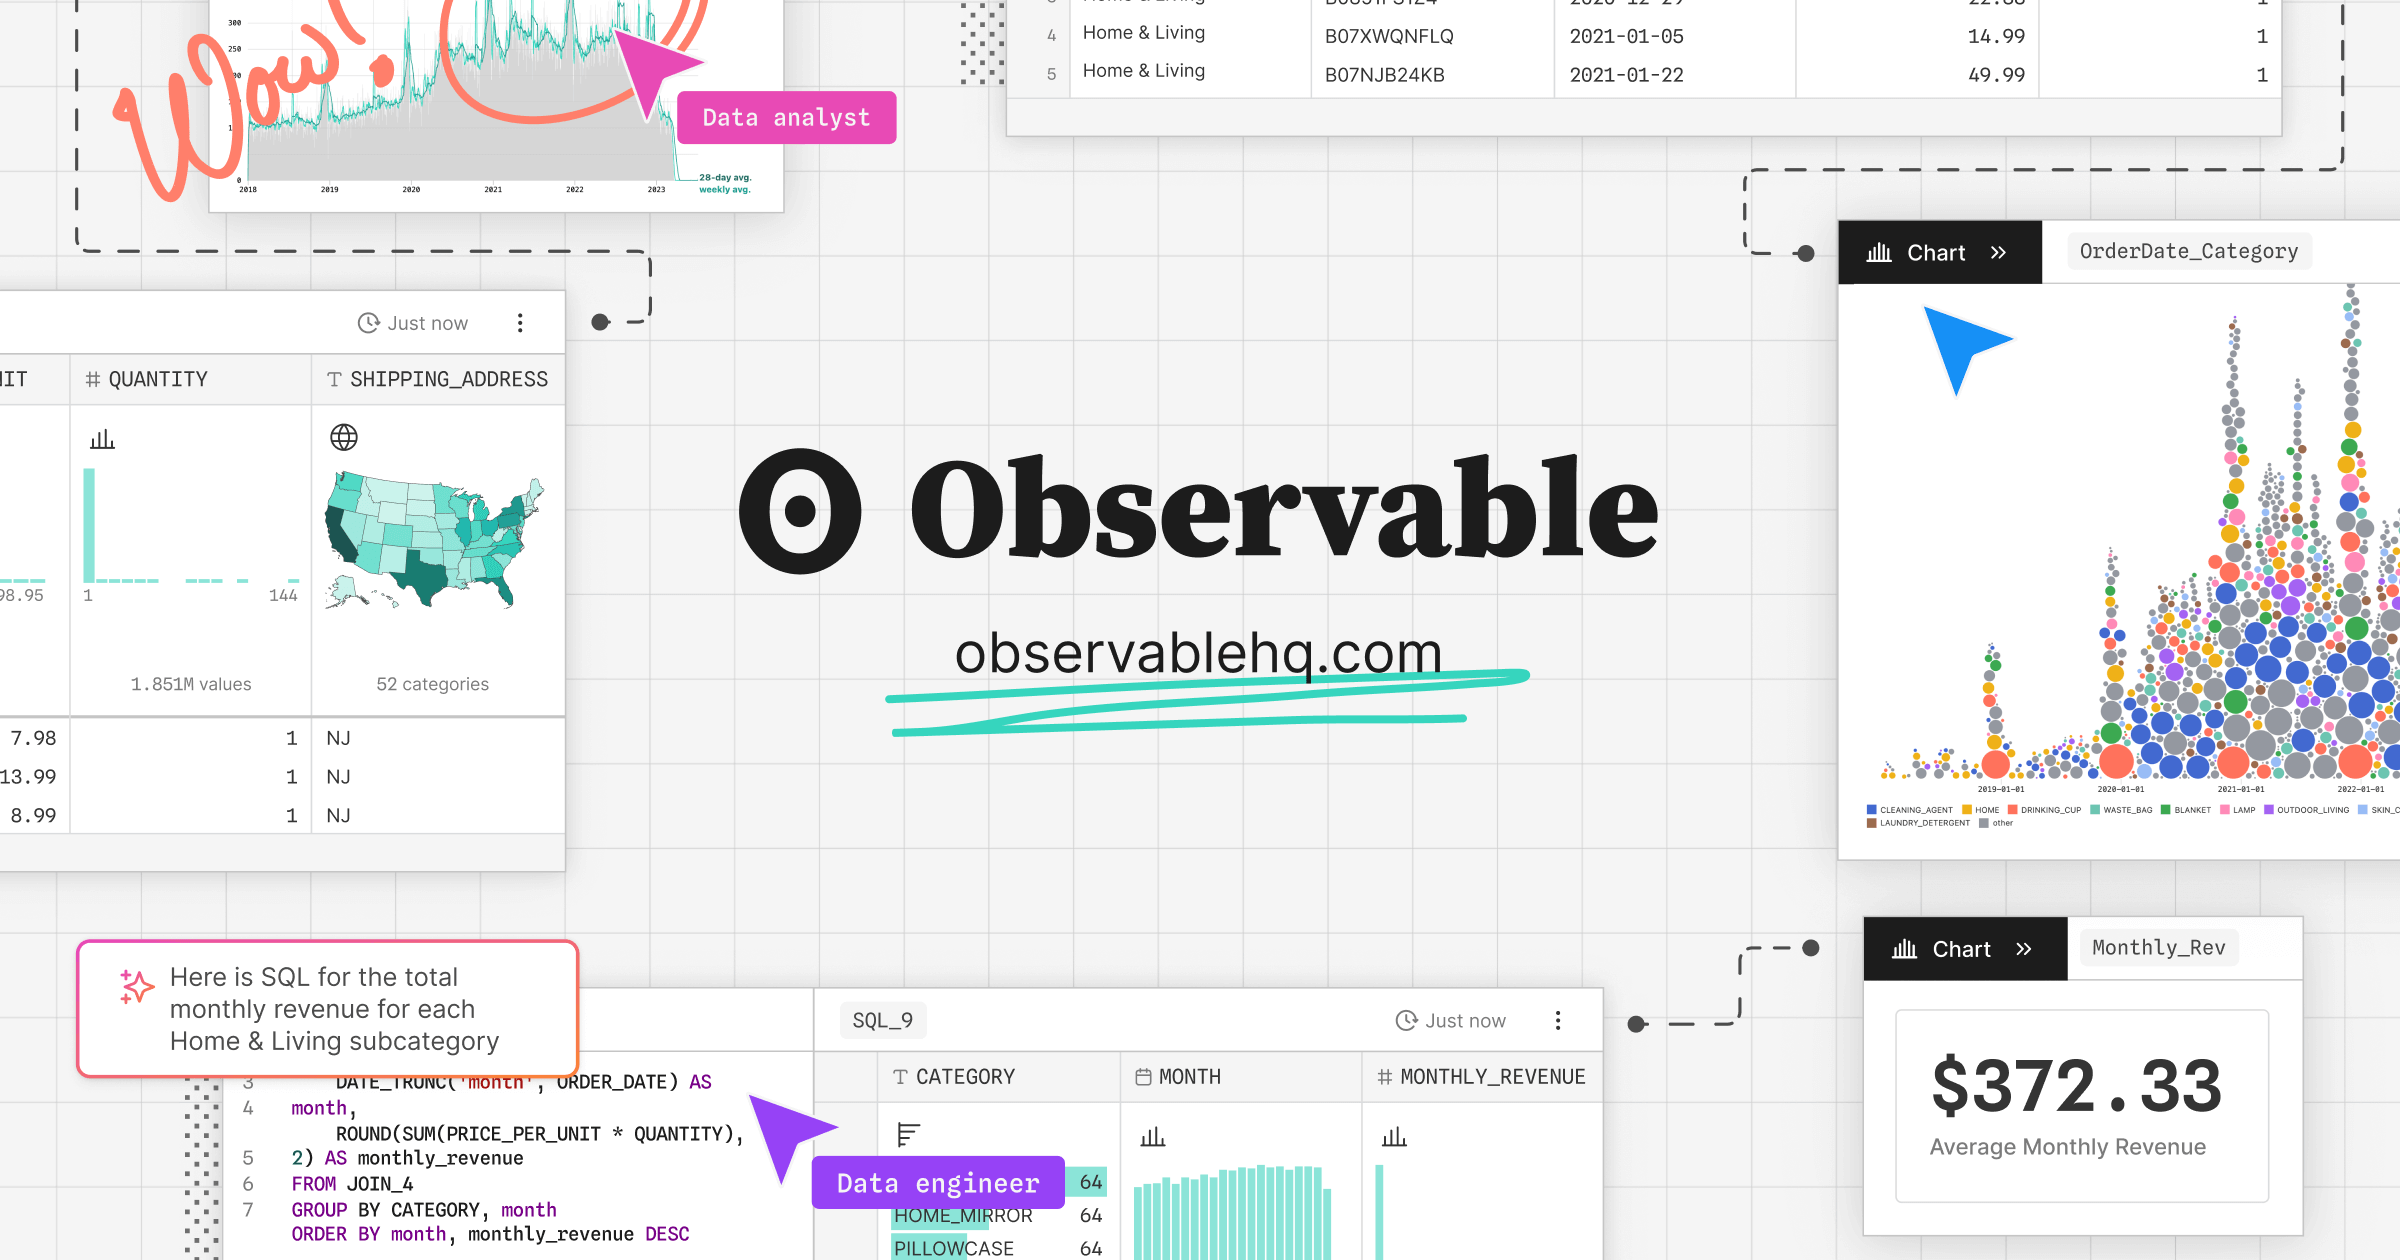
Observable Canvases | Explore and visualize data together
Observable’s collaborative data canvas helps you explore data, perform analysis, and build expressive charts and dashboards.
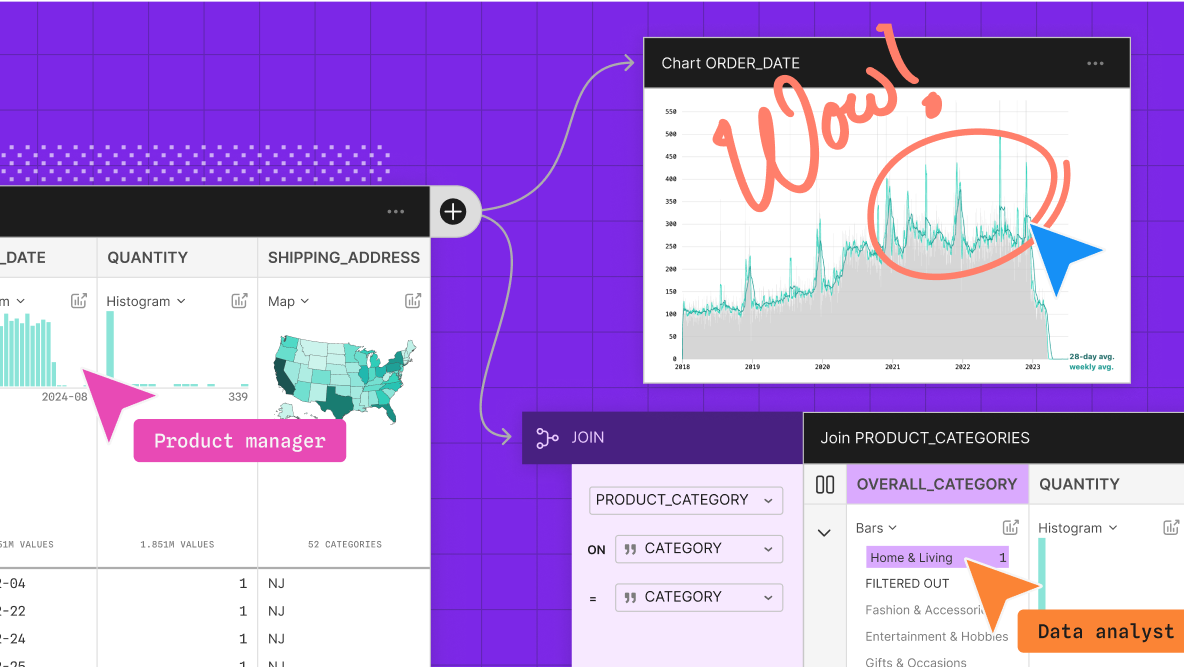
Introducing Observable Canvases
A new way to explore, visualize, and collaborate with data — all in one shared canvas.
Sigma.js
a JavaScript library aimed at visualizing graphs of thousands of nodes and edges
G6 Graph Visualization Framework in JavaScript
G6 is a graph visualization framework with simplicity and convenience. Based on the ability of customization, it provides elegant graph visualization solutions, helping developers build applications for graph visualization, analysis, and editing.

kepano (@stephango.com)
This is Pele, my new rendering library for diagrams and charts, compatible with the latest Mermaid syntax. - 100-500× faster than mermaid.js - 6× smaller bundle - No dependencies - Easy to theme - Responsive to device width - Open source (MIT) Try it at pele.run

An AI Agent Published a Hit Piece on Me
Scott Shambaugh helps maintain the excellent and venerable matplotlib Python charting library, including taking on the thankless task of triaging and reviewing incoming pull requests. A GitHub account called @crabby-rathbun …
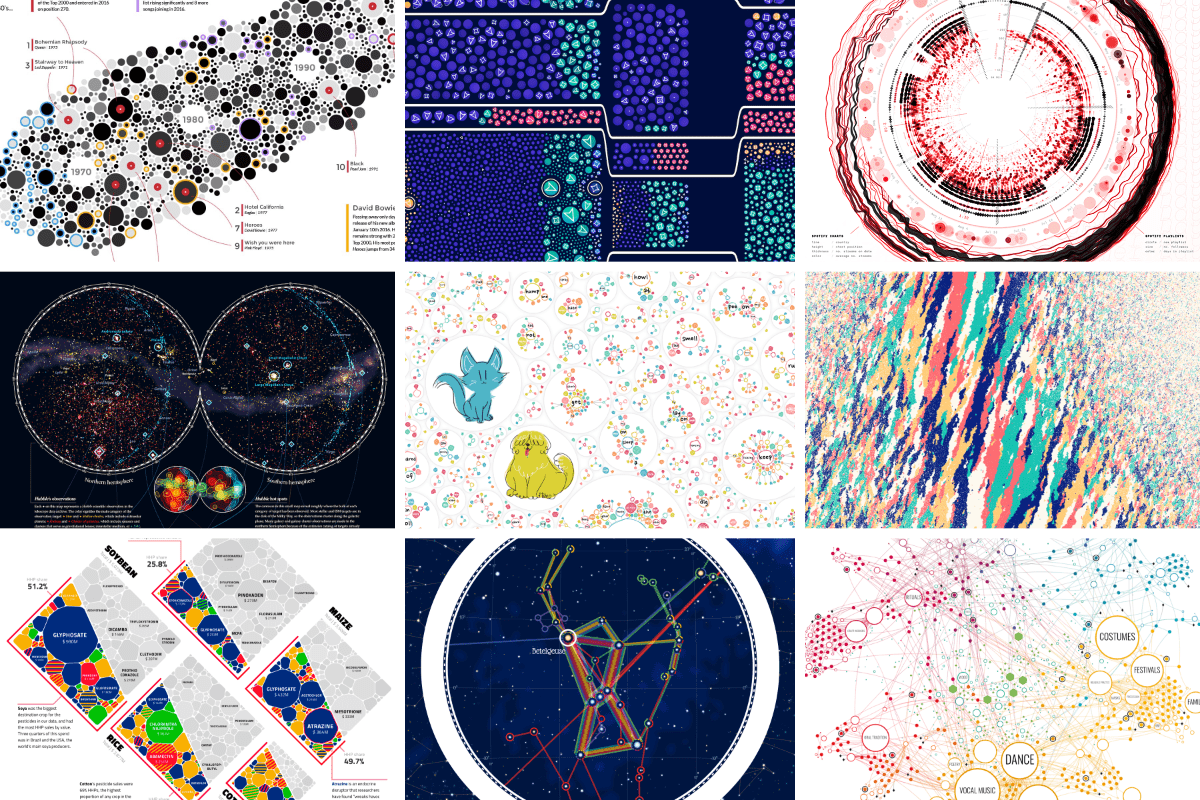
An Award-winning Data Visualization Designer
Visual Cinnamon | Data Visualization Design & Data Art | Data made insightful, effective & beautiful through data visualization and data art
Datatype — variable font that turns text into charts
An OpenType variable font that turns simple text expressions into inline charts. No JavaScript, no images — just type.
TanStack Charts
A typed, tree-shakable chart grammar for SVG and Canvas. Compose marks, views, scales, transforms, interactions, and motion with compact primitives or D3-compatible inputs.
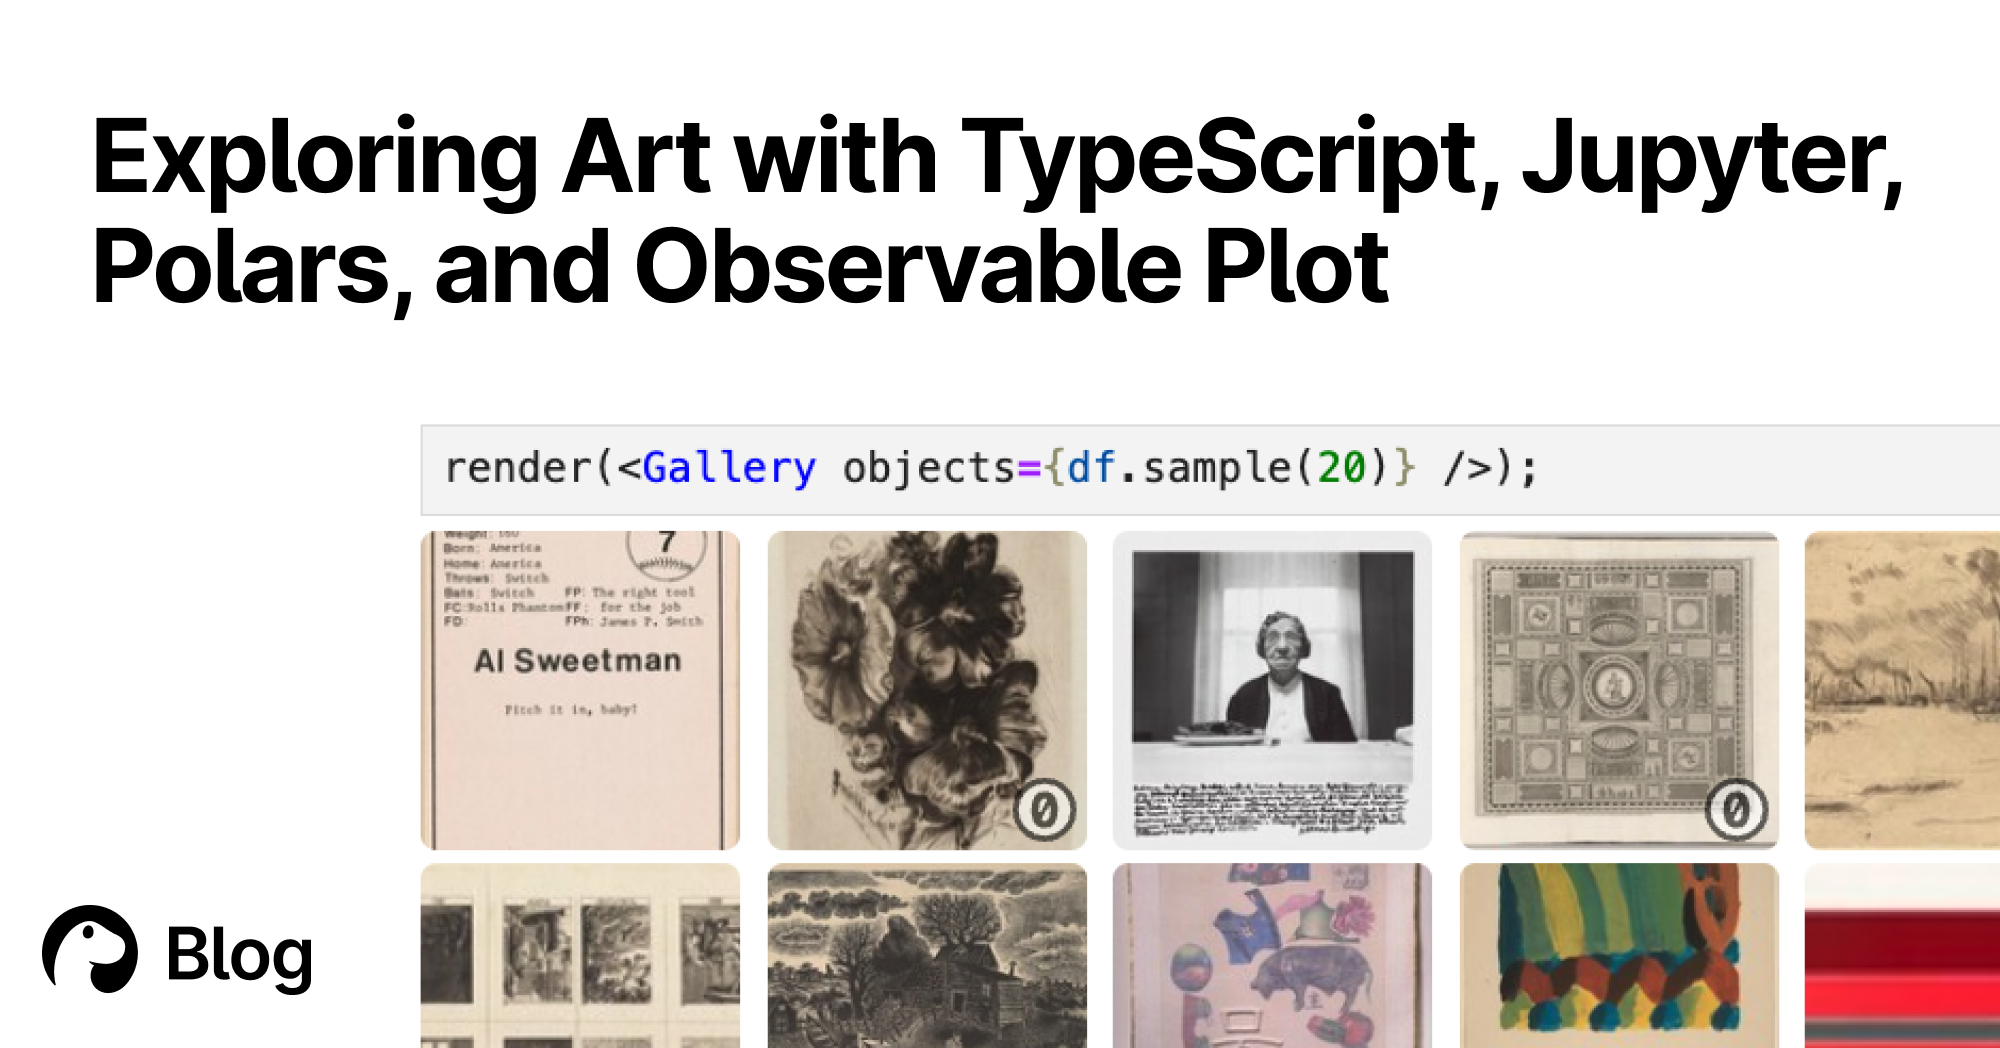
Exploring Art with TypeScript, Jupyter, Polars, and Observable Plot | Deno
With Deno's Jupyter support, you can explore, interact, and create interactive charts with TypeScript and HTML. Here's a tutorial featuring data of over 130,000 famous artworks.
Create interactive mini-apps with Sheets canvas
Really cool idea 🤯 - Install this web font - Just add plain text to the DOM - It renders a chart using font ligatures No JS, no hydration FOUC franktisellano.github.io/datatype/
