High-performance Toolkit for WebGL-based Data Visualization
modular and versioned GLSL
a WebGL demo of glsl-lut, for efficient color transforms on the GPU. source code here Contents # Intro glslify Installing Dependencies Compiling The Shader Relative Requires Example Modules The Awesomeness of NPM Unit Testing Extras As a Source...

Visualizing GL_NV_shader_sm_builtins
Using GL_NV_shader_sm_builtins to visualize Streaming Multiprocessors and Warps
stack.gl
Before getting started with stackgl, you'll want to get familiar with the basics of WebGL and GLSL. One place to start would be by trying out one of our graphics-themed NodeSchool workshops. Shader School and WebGL Workshop are interactive and may be taken in any order.
GitHub - observablehq/plot: A concise API for exploratory data visualization implementing a layered grammar of graphics
A concise API for exploratory data visualization implementing a layered grammar of graphics - observablehq/plot
GitHub - HEmile/juggl: An interactive, stylable and expandable graph view for Obsidian. Juggl is designed as an advanced 'local' graph view, where you can juggle all your thoughts with ease.
An interactive, stylable and expandable graph view for Obsidian. Juggl is designed as an advanced 'local' graph view, where you can juggle all your thoughts with ease. - GitHub - H...
G6 Graph Visualization Framework in JavaScript
G6 is a graph visualization framework with simplicity and convenience. Based on the ability of customization, it provides elegant graph visualization solutions, helping developers build applications for graph visualization, analysis, and editing.

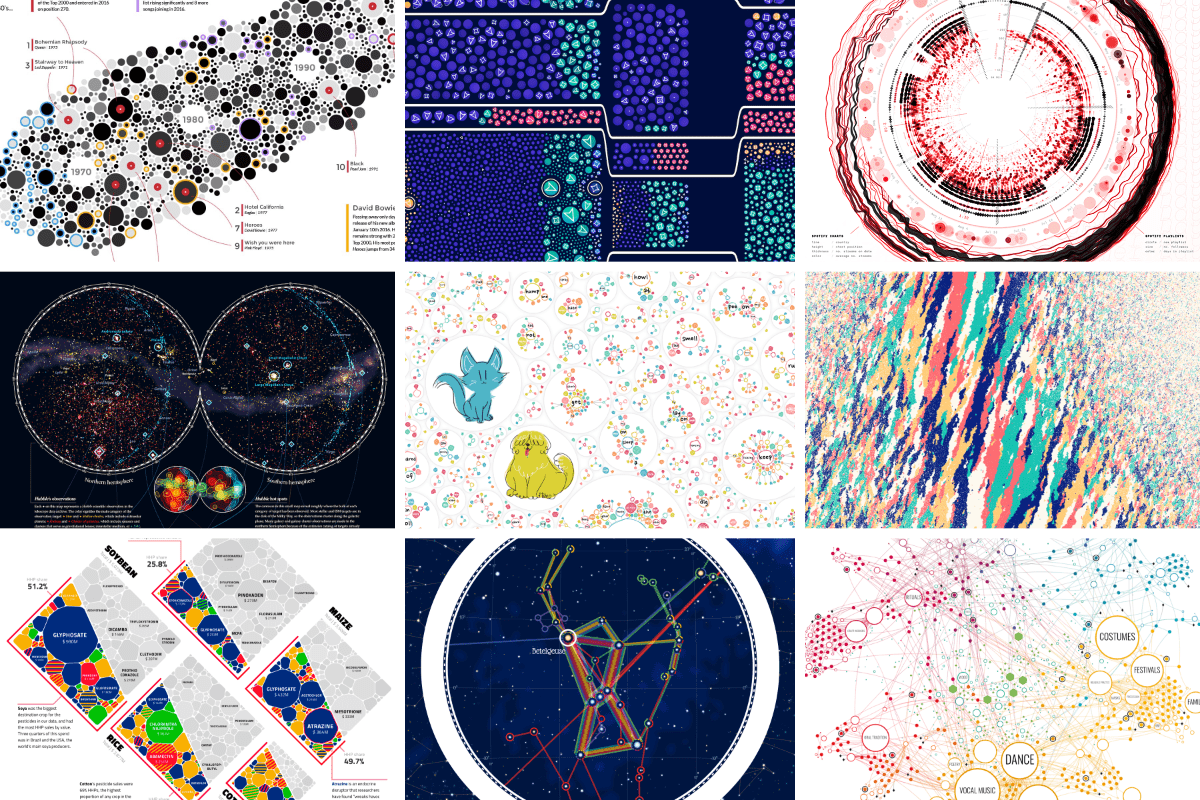
An Award-winning Data Visualization Designer
Visual Cinnamon | Data Visualization Design & Data Art | Data made insightful, effective & beautiful through data visualization and data art
visualising data structures and algorithms through animation - VisuAlgo
VisuAlgo was conceptualised in 2011 by Associate Professor Steven Halim (NUS School of Computing) as a tool to help his students better understand data structures and algorithms, by allowing them to learn the basics on their own and at their own pace. Together with his students from the National University of Singapore, a series of visualizations were developed and consolidated, from simple sorting algorithms to complex graph data structures. Though specifically designed for the use of NUS students taking various data structure and algorithm classes (CS1010/equivalent, CS2040/equivalent (inclusive of IT5003)), CS3230, CS3233, and CS4234), as advocators of online learning, we hope that curious minds around the world will find these visualizations useful as well.
Sigma.js
a JavaScript library aimed at visualizing graphs of thousands of nodes and edges
GitHub - playcanvas/engine: Powerful web graphics runtime built on WebGL, WebGPU, WebXR and glTF
Powerful web graphics runtime built on WebGL, WebGPU, WebXR and glTF - playcanvas/engine
VisQuill – Reactive Geometry for Interactive Data Visualization
VisQuill lets you explore data through interactive visuals or build your own using a reactive geometry SDK. Create geospatial and interactive visual systems with real-time updates.

Thousands of Styled Rectangles in 120FPS on GPU
Secrets of rendering extremely fast UIs in WebGPU by minimizing overhead on the GPU.

Dremel: interactive analysis of web-scale datasets: Proceedings of the VLDB Endowment: Vol 3, No 1-2
Dremel is a scalable, interactive ad-hoc query system for analysis of read-only nested data. By combining multi-level execution trees and columnar data layout, it is capable of running aggregation queries over trillion-row tables in seconds. The system ...

WebGPU is now supported in major browsers | Blog | web.dev
Read about the biggest web graphics launch since WebGL. WebGPU is supported across major browsers, bringing unparalleled performance to the web.