

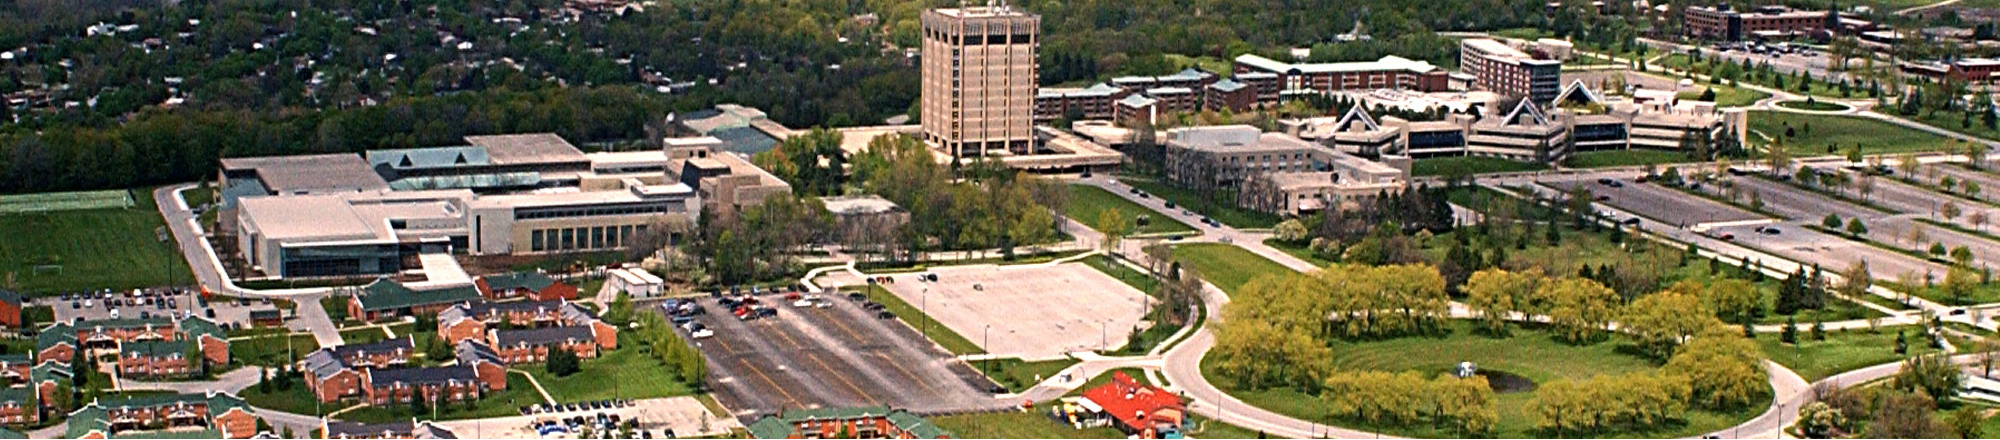
The 34th International Symposium on Graph Drawing and Network Visualization will be held at Brock University in St. Catharines, Ontario, Canada from August 17-21, 2026. A PhD school will take place on August 17-18, 2026.
Hive Plots - Linear Layout for Network Visualization - Visually Interpreting Network Structure and Content Made Possible
the hive plot is a perceptually uniform and scalable linear layout visualization for network visual analytics
Cosmograph: Beautiful Visualization and Analytics | Cosmograph
Beautiful Visualization and Analytics

GitHub - HEmile/juggl: An interactive, stylable and expandable graph view for Obsidian. Juggl is designed as an advanced 'local' graph view, where you can juggle all your thoughts with ease.
An interactive, stylable and expandable graph view for Obsidian. Juggl is designed as an advanced 'local' graph view, where you can juggle all your thoughts with ease. - GitHub - H...
Sigma.js
a JavaScript library aimed at visualizing graphs of thousands of nodes and edges
On power, aesthetics, materiality and change in data visualization
Notes from the Information+ Conference at MIT/Northeastern University, Boston.
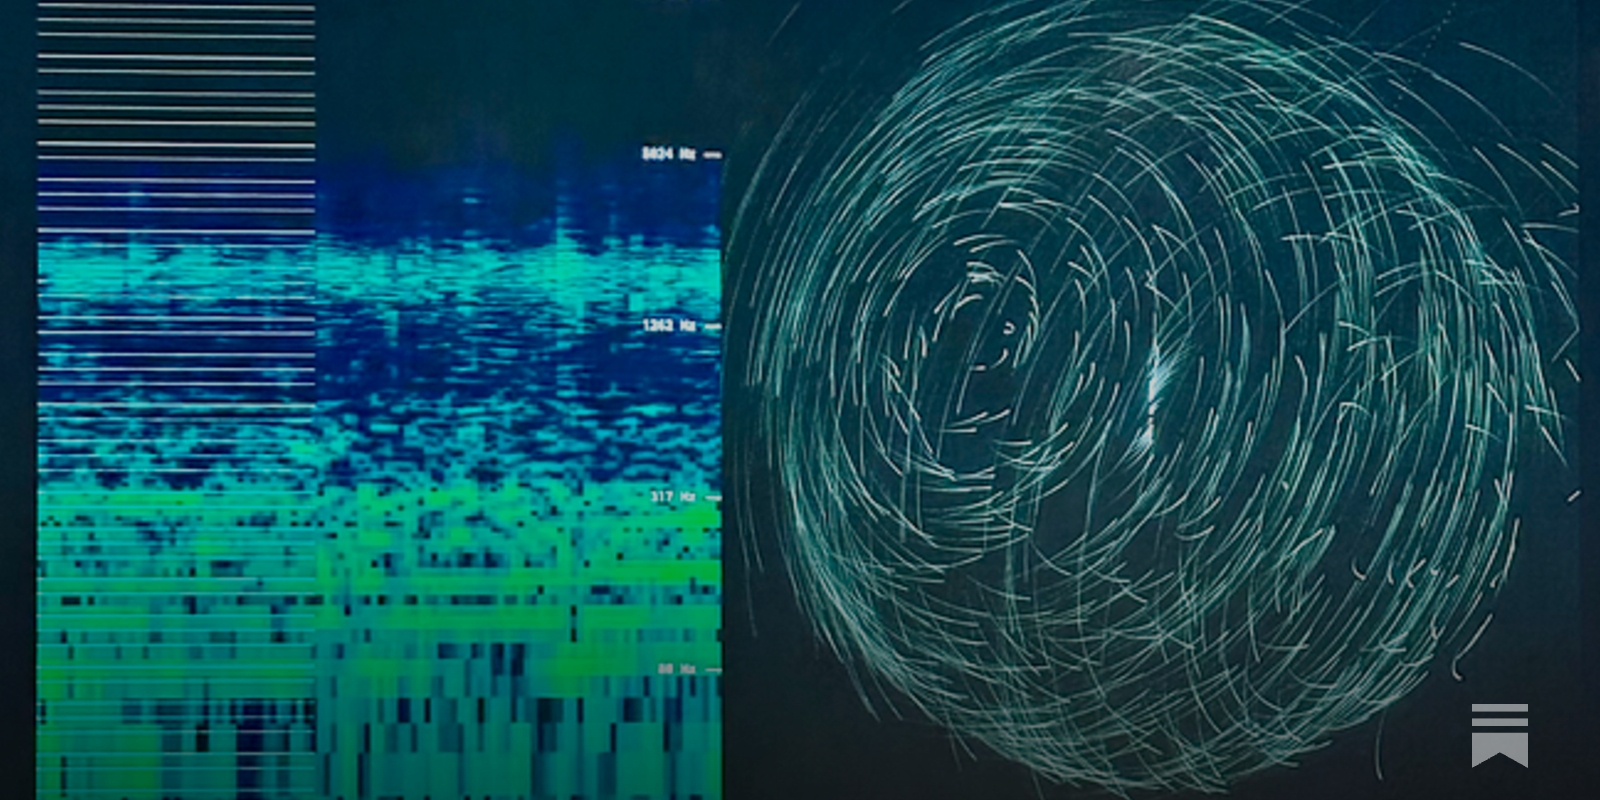
visualising data structures and algorithms through animation - VisuAlgo
VisuAlgo was conceptualised in 2011 by Associate Professor Steven Halim (NUS School of Computing) as a tool to help his students better understand data structures and algorithms, by allowing them to learn the basics on their own and at their own pace. Together with his students from the National University of Singapore, a series of visualizations were developed and consolidated, from simple sorting algorithms to complex graph data structures. Though specifically designed for the use of NUS students taking various data structure and algorithm classes (CS1010/equivalent, CS2040/equivalent (inclusive of IT5003)), CS3230, CS3233, and CS4234), as advocators of online learning, we hope that curious minds around the world will find these visualizations useful as well.
Sustainable coordination in research labs via graph-enabled idea boards
Our 'graph-enabled idea board' serves as a hub for capturing excess research ideas, allocating microprojects, and properly attributing credit. We'd like to investigate its potential for enabling newcomers to quickly and effectively contribute to ongoing projects.
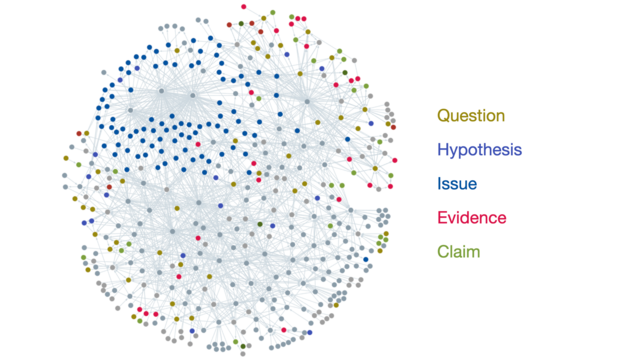
Cytoscape: An Open Source Platform for Complex Network Analysis and Visualization
Cytoscape Official Web Site
Terminal Graph — A spatial development environment for macOS
See everything. Switch nothing. Terminals, browsers, editors, and notes on one infinite canvas with dataflow connections. Native macOS.

The Together Project
What if we could actually see the acknowledgement graph that connects humans and communities in a hidden economic web?

Lab Notes #007: Semble Following - Cosmik Labs
The Cosmik Network social graph launches
G6 Graph Visualization Framework in JavaScript
G6 is a graph visualization framework with simplicity and convenience. Based on the ability of customization, it provides elegant graph visualization solutions, helping developers build applications for graph visualization, analysis, and editing.

It's the update you've all been waiting for! This marks a major milestone for Terminal Graph. I'm excited to see what you all build, please share your creations with the world (and tag me)! You can download it at terminalgraph.com

Caidan
All of the pieces are finally starting to come together! This is the level of composability I had first imagined for terminal graph. Update coming soon!
made a little thing login -> vouch -> explore the graph atvouch.dev

