

Scalable, interactive data visualization
GitHub - observablehq/plot: A concise API for exploratory data visualization implementing a layered grammar of graphics
A concise API for exploratory data visualization implementing a layered grammar of graphics - observablehq/plot
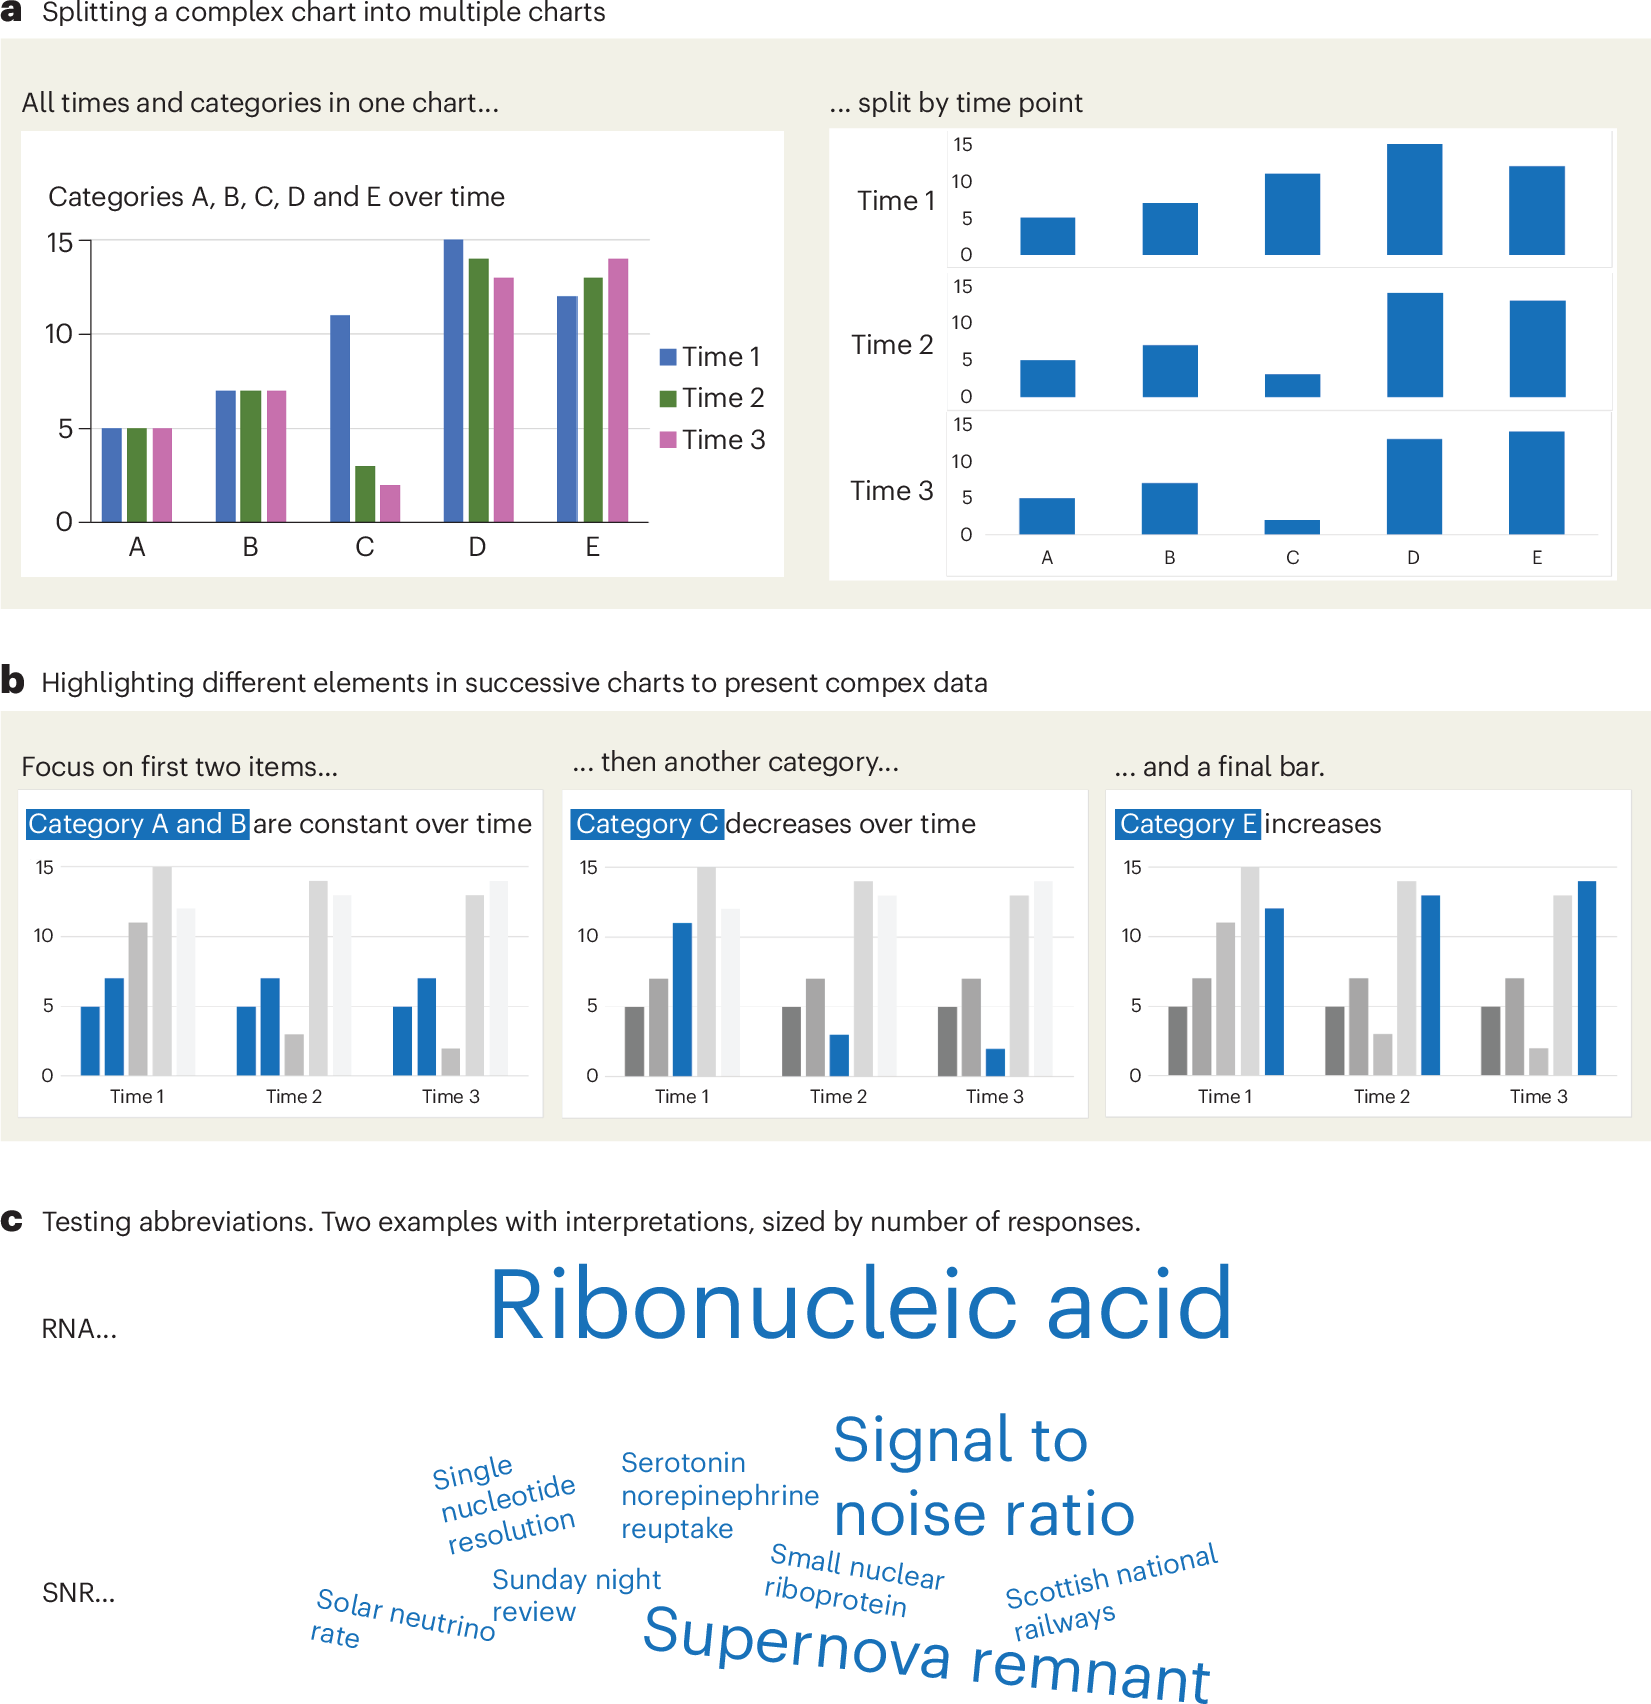
A checklist for designing and improving the visualization of scientific data
Creating clear and engaging scientific figures is crucial to communicate complex data. In this Comment, I condense principles from design, visual perception and data visualization research in a checklist that can help researchers to improve their data visualization, by focusing on clarity, accessibility and design best practices.
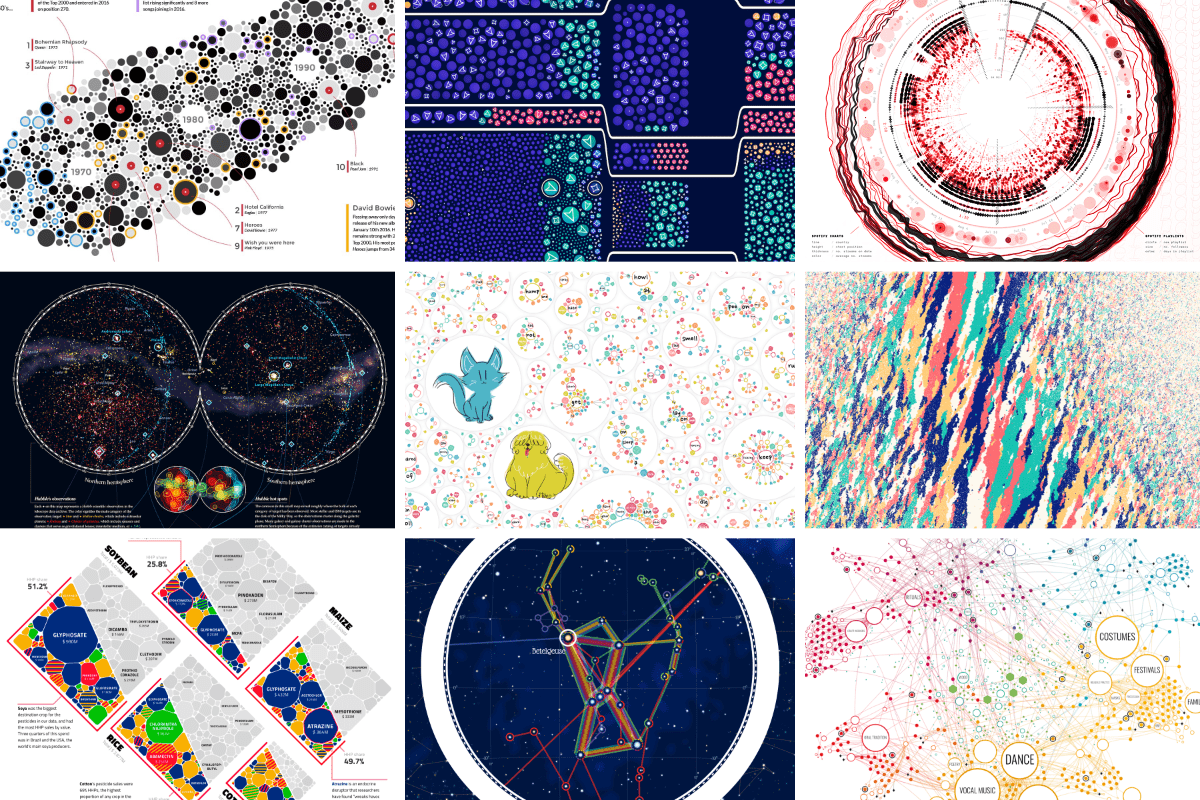
An Award-winning Data Visualization Designer
Visual Cinnamon | Data Visualization Design & Data Art | Data made insightful, effective & beautiful through data visualization and data art
visualising data structures and algorithms through animation - VisuAlgo
VisuAlgo was conceptualised in 2011 by Associate Professor Steven Halim (NUS School of Computing) as a tool to help his students better understand data structures and algorithms, by allowing them to learn the basics on their own and at their own pace. Together with his students from the National University of Singapore, a series of visualizations were developed and consolidated, from simple sorting algorithms to complex graph data structures. Though specifically designed for the use of NUS students taking various data structure and algorithm classes (CS1010/equivalent, CS2040/equivalent (inclusive of IT5003)), CS3230, CS3233, and CS4234), as advocators of online learning, we hope that curious minds around the world will find these visualizations useful as well.
Introducing Observable Canvases
A new way to explore, visualize, and collaborate with data — all in one shared canvas.
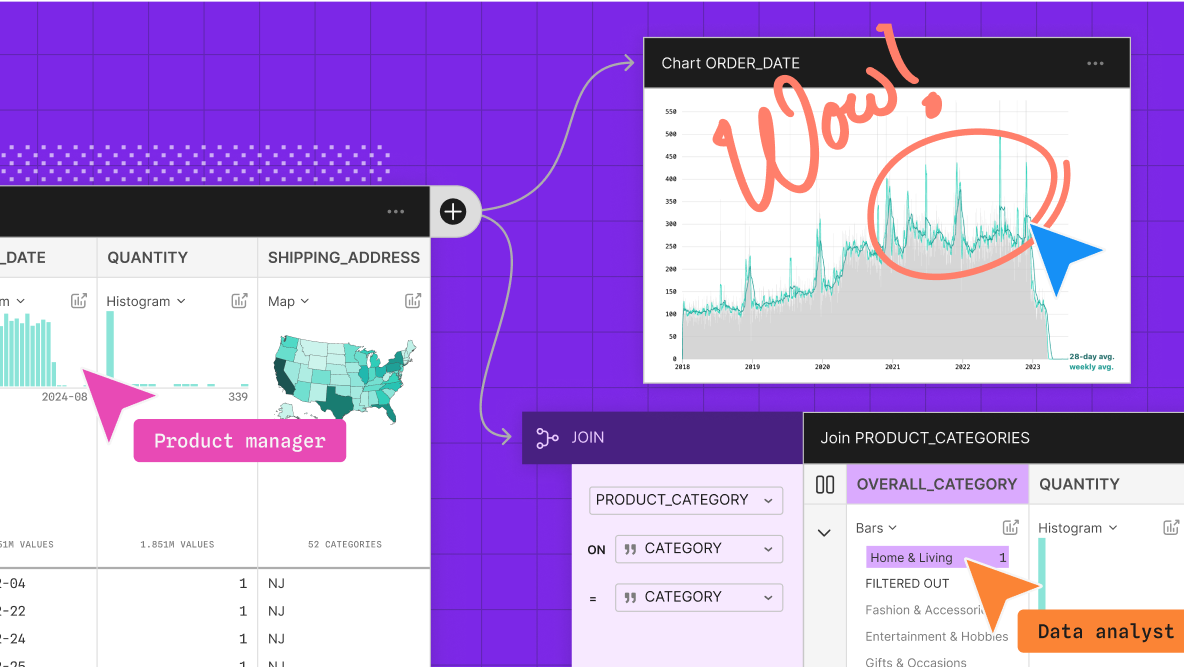
Hive Plots - Linear Layout for Network Visualization - Visually Interpreting Network Structure and Content Made Possible
the hive plot is a perceptually uniform and scalable linear layout visualization for network visual analytics
Chart Design Principles | Hands-On Data Visualization
Tell your story and show it with data, using free and easy-to-learn tools on the web. This introductory book teaches you how to design interactive charts and customized maps for your website, beginning with easy drag-and-drop tools, such as Google Sheets, Datawrapper, and Tableau Public. You will also gradually learn how to edit open-source code templates built with Chart.js, Highcharts, and Leaflet on GitHub. Follow along with the step-by-step tutorials, real-world examples, and online resources. This book is ideal for students, non-profit organizations, small business owners, local governments, journalists, academics, or anyone who wants to tell their story and show the data. No coding experience is required.
Cosmograph: Beautiful Visualization and Analytics | Cosmograph
Beautiful Visualization and Analytics

Drawing a map of distributed data systems — Martin Kleppmann’s blog
How we created an illustrated guide to help you find your way through the data landscape.
Dremel: interactive analysis of web-scale datasets: Proceedings of the VLDB Endowment: Vol 3, No 1-2
Dremel is a scalable, interactive ad-hoc query system for analysis of read-only nested data. By combining multi-level execution trees and columnar data layout, it is capable of running aggregation queries over trillion-row tables in seconds. The system ...

Your Data Fits in Memory (GraphD Part 1)
We need a fast way to query multiple potentially large sets of data on-demand at interactive speeds. Sometimes the easiest solution to a hard problem is to build the right tool for the job.
VisQuill – Reactive Geometry for Interactive Data Visualization
VisQuill lets you explore data through interactive visuals or build your own using a reactive geometry SDK. Create geospatial and interactive visual systems with real-time updates.

The poster to accompany Designing Data-Intensive Applications (DDIA)
Each chapter in Designing Data-Intensive Applications is accompanied by a map. And we’ve turned those maps into a beautiful poster.
Svelte - Data Visualization

MIERUNE/svelte-maplibre-gl
Rich-Harris/pancake
www.npmjs.com
Unovis

Layer Cake

TanStack Table