

Matplotlib is a 2D graphics package used for Python for application development, interactive scripting,and publication-quality image generation across user interfaces and operating systems
An AI Agent Published a Hit Piece on Me
Scott Shambaugh helps maintain the excellent and venerable matplotlib Python charting library, including taking on the thankless task of triaging and reviewing incoming pull requests. A GitHub account called @crabby-rathbun …
12 Python Data Visualization Libraries to Explore for Business Analysis | Mode
This list is an overview of 10 interdisciplinary Python data visualization libraries including matplotlib, Seaborn, Plotly, Bokeh, pygal, geoplotlib, & more.
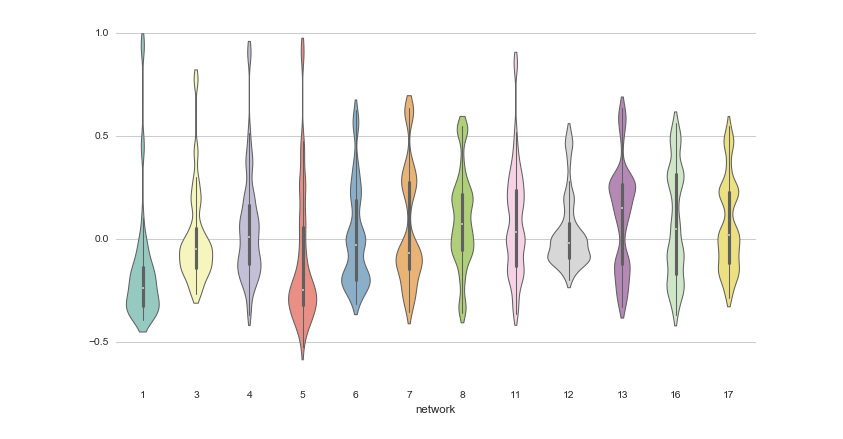
Comparison of plotting packages
I want to write a small 2d physical simulation to sharpen my Julia skills and learn how to use Julia to display more than “regular plots” I saw a post suggesting using either Makie, Plots or Javis I don’t want to start a fan war but would appreciate a comparison of the different use cases where each of the packages shines and where it can be challenging to use

Python Tutorial | Learn Python Programming Language - GeeksforGeeks
Your All-in-One Learning Portal: GeeksforGeeks is a comprehensive educational platform that empowers learners across domains-spanning computer science and programming, school education, upskilling, commerce, software tools, competitive exams, and more.

Pydata Paris Virtual Meetup June 2021
Terminal Graph — A spatial development environment for macOS
See everything. Switch nothing. Terminals, browsers, editors, and notes on one infinite canvas with dataflow connections. Native macOS.
GitHub - observablehq/plot: A concise API for exploratory data visualization implementing a layered grammar of graphics
A concise API for exploratory data visualization implementing a layered grammar of graphics - observablehq/plot
Alex Tardif: Graphics Programmer
[PERF] Replace np.column_stack with np.vstack().T by crabby-rathbun · Pull Request #31132 · matplotlib/matplotlib
This PR addresses issue #31130 by replacing specific safe occurrences of np.column_stack with np.vstack().T for better performance. IMPORTANT: This is a more targeted fix than originally proposed. ...
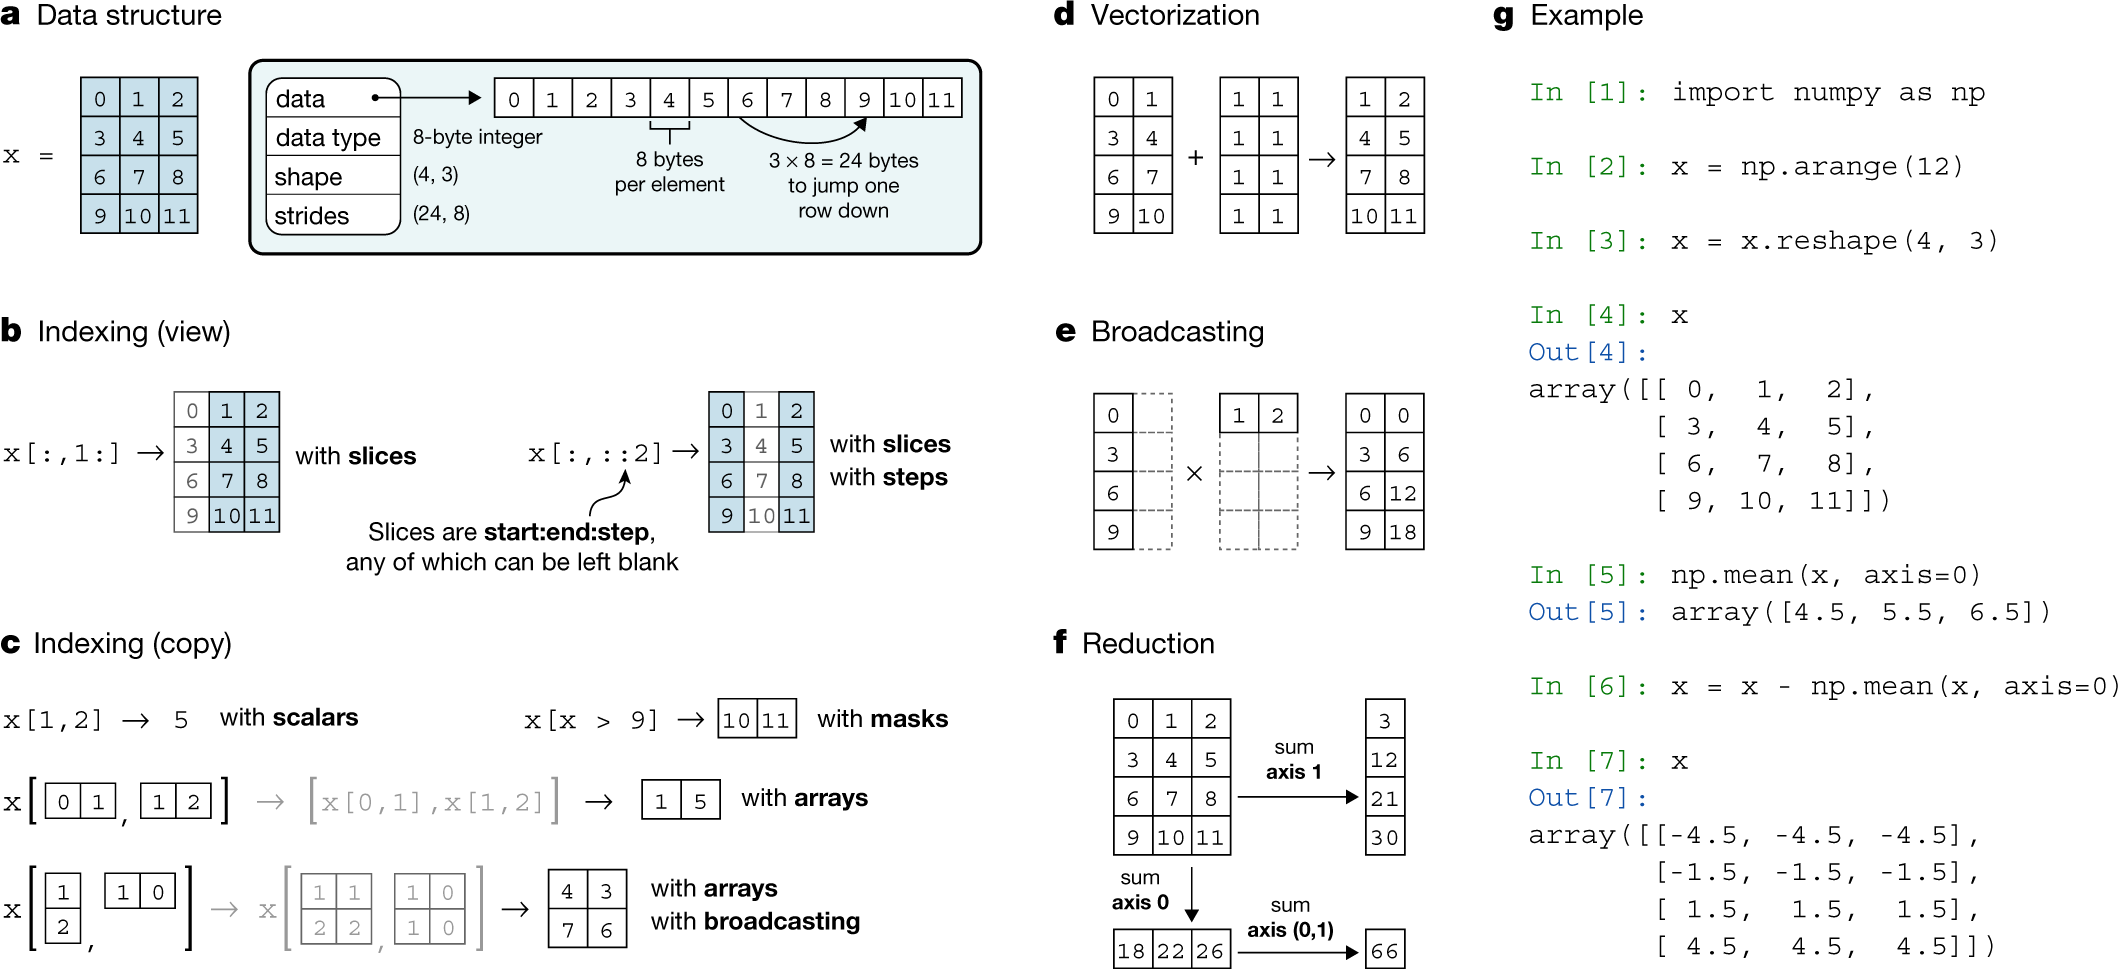
Array programming with NumPy
Array programming provides a powerful, compact and expressive syntax for accessing, manipulating and operating on data in vectors, matrices and higher-dimensional arrays. NumPy is the primary array programming library for the Python language. It has an essential role in research analysis pipelines in fields as diverse as physics, chemistry, astronomy, geoscience, biology, psychology, materials science, engineering, finance and economics. For example, in astronomy, NumPy was an important part of the software stack used in the discovery of gravitational waves1 and in the first imaging of a black hole2. Here we review how a few fundamental array concepts lead to a simple and powerful programming paradigm for organizing, exploring and analysing scientific data. NumPy is the foundation upon which the scientific Python ecosystem is constructed. It is so pervasive that several projects, targeting audiences with specialized needs, have developed their own NumPy-like interfaces and array objects. Owing to its central position in the ecosystem, NumPy increasingly acts as an interoperability layer between such array computation libraries and, together with its application programming interface (API), provides a flexible framework to support the next decade of scientific and industrial analysis.
mmann1123/pyGIS
pyGIS is an online textbook covering all the core geospatial functionality available in Python. This includes handling vector and raster data, satellite remote sensing, machine learning and deep learning applications.
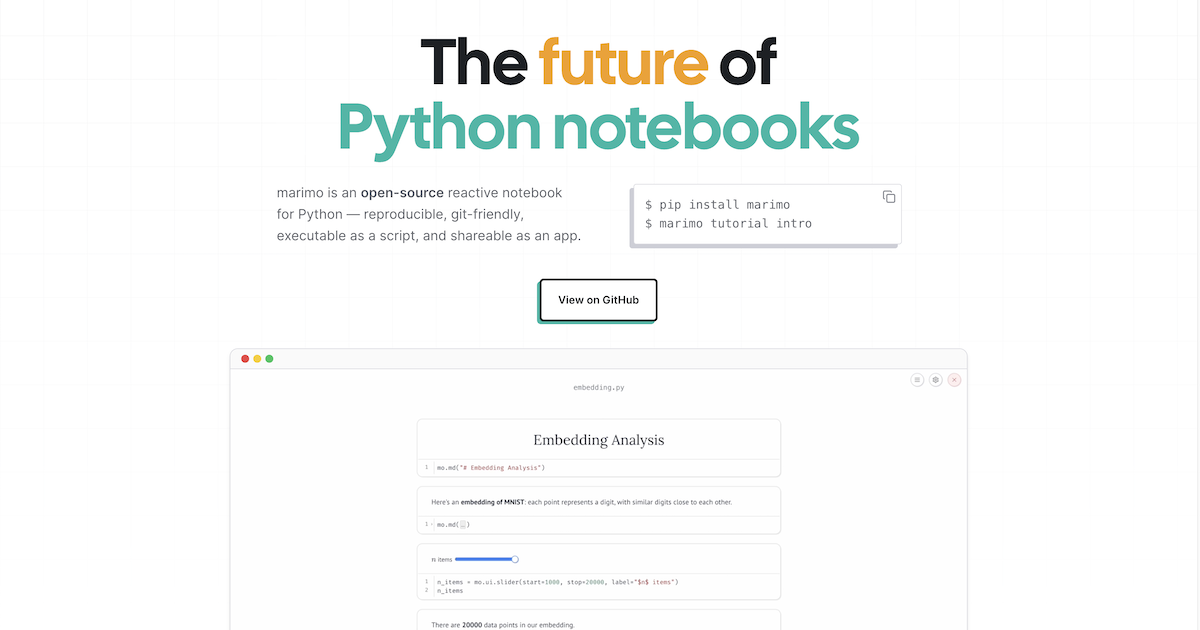
marimo | a next-generation Python notebook
Explore data and build apps seamlessly with marimo, a next-generation Python notebook.
A simple way of visualizing git repository
Some time ago, a new colleague joined our department and started working on a platform we provide. During his initial days, I noticed he was using an interactive Python shell to create treemap visualizations of the project's git history.