


Distilling the world's data, information & knowledge into beautiful infographics & visualizations
On power, aesthetics, materiality and change in data visualization
Notes from the Information+ Conference at MIT/Northeastern University, Boston.
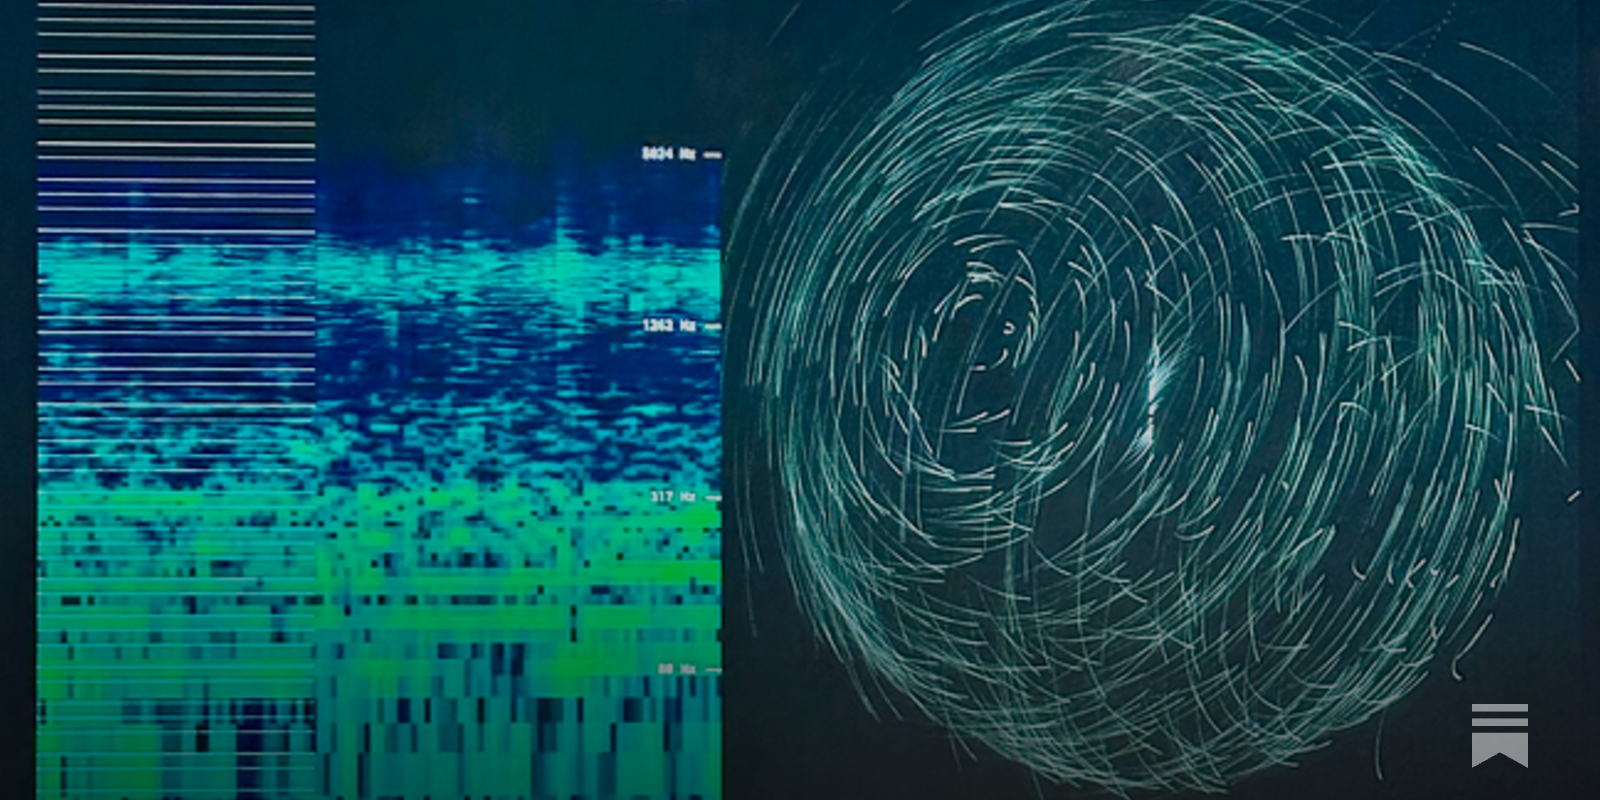
A checklist for designing and improving the visualization of scientific data
Creating clear and engaging scientific figures is crucial to communicate complex data. In this Comment, I condense principles from design, visual perception and data visualization research in a checklist that can help researchers to improve their data visualization, by focusing on clarity, accessibility and design best practices.
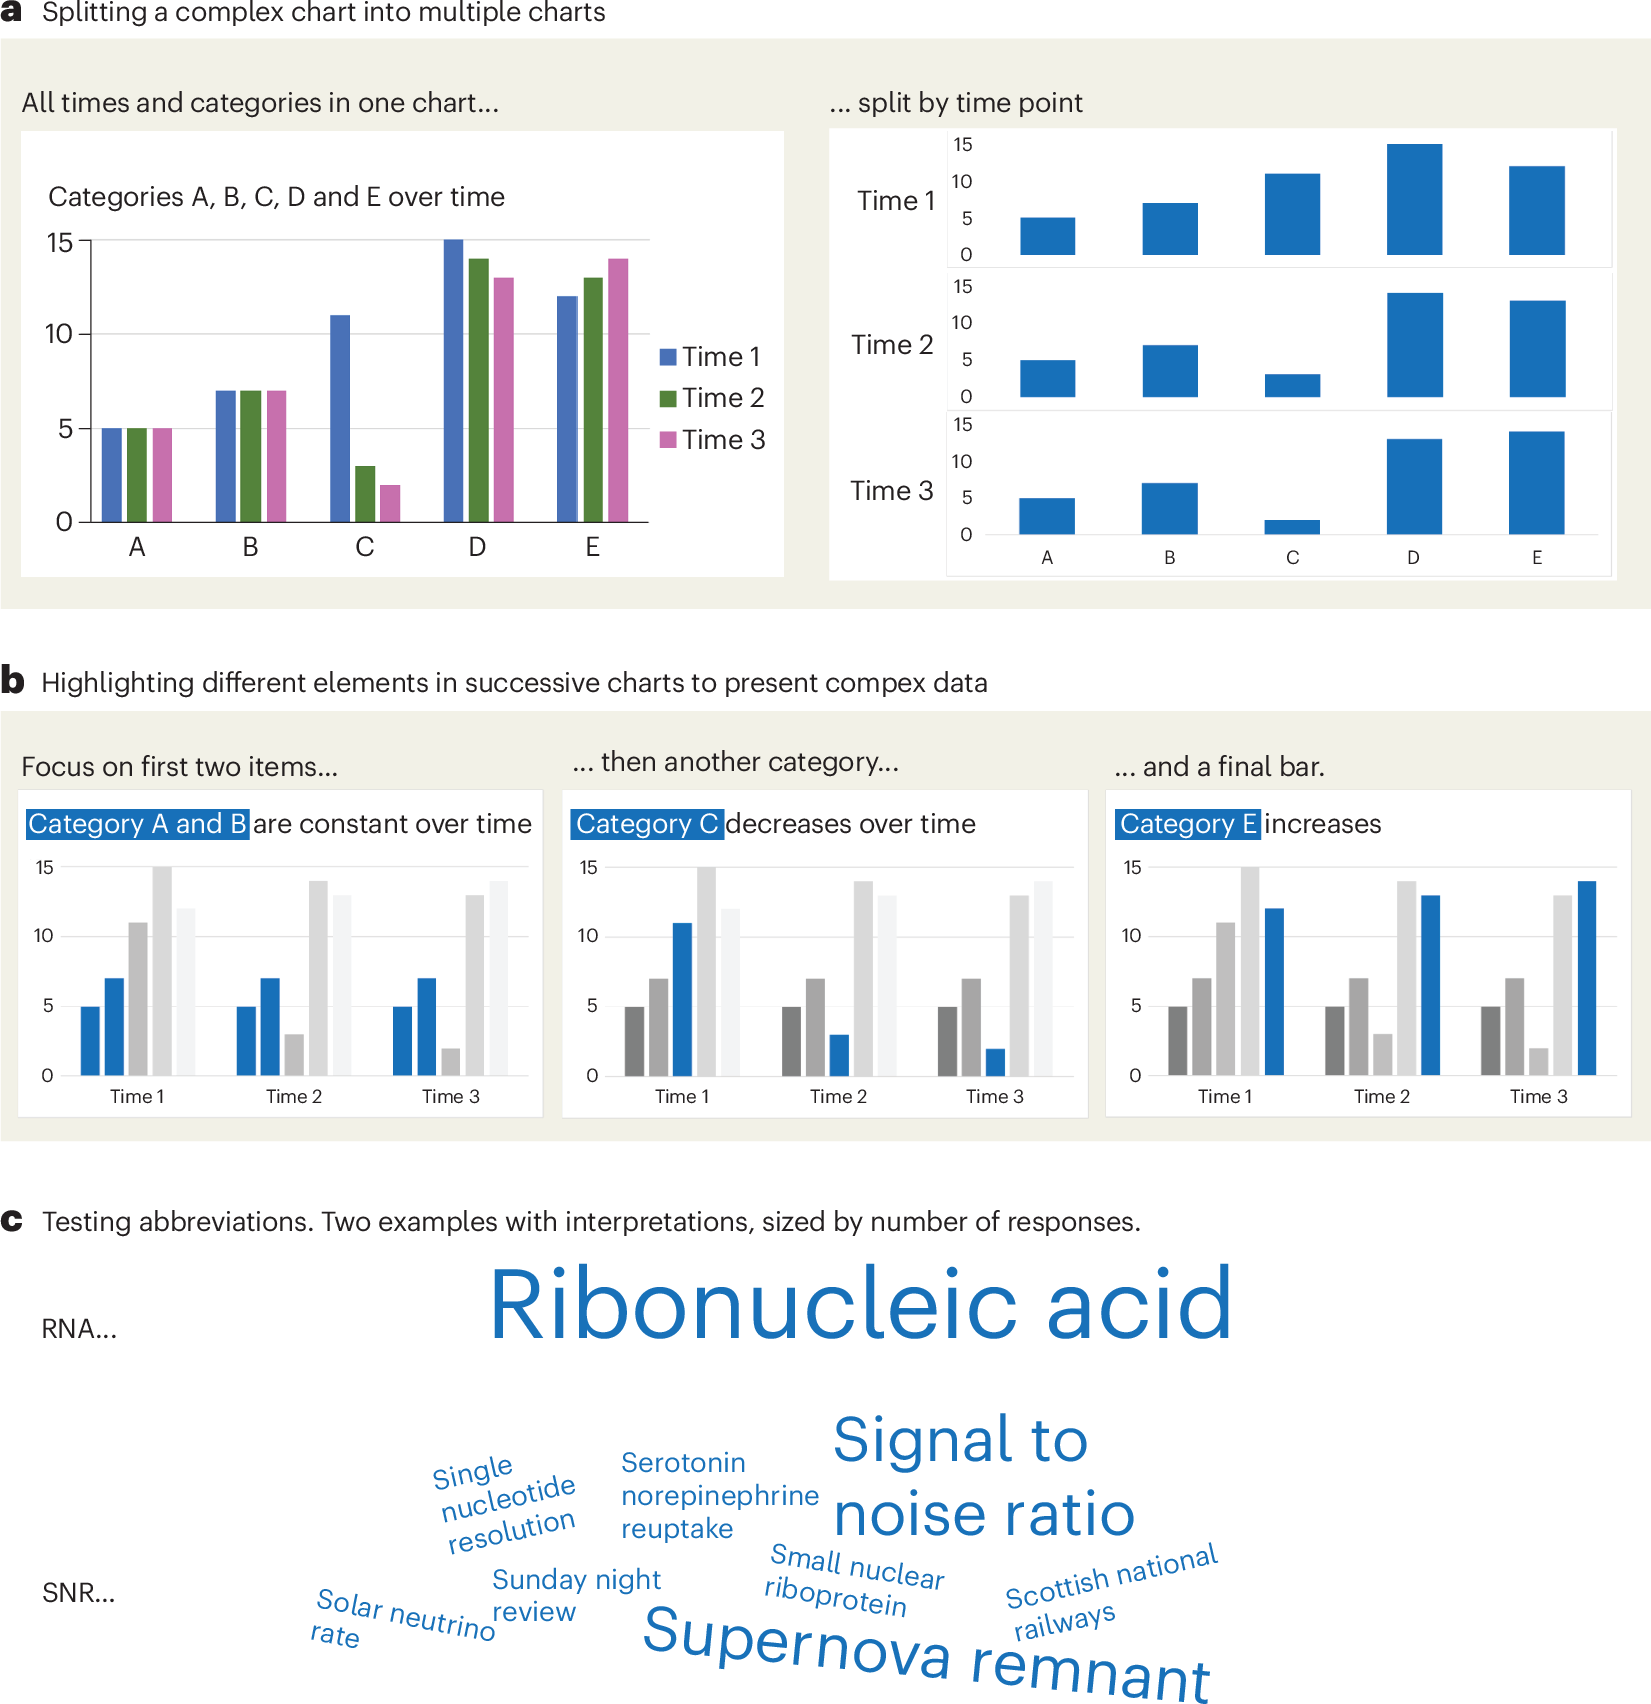
Cosmograph: Beautiful Visualization and Analytics | Cosmograph
Beautiful Visualization and Analytics

An Award-winning Data Visualization Designer
Visual Cinnamon | Data Visualization Design & Data Art | Data made insightful, effective & beautiful through data visualization and data art
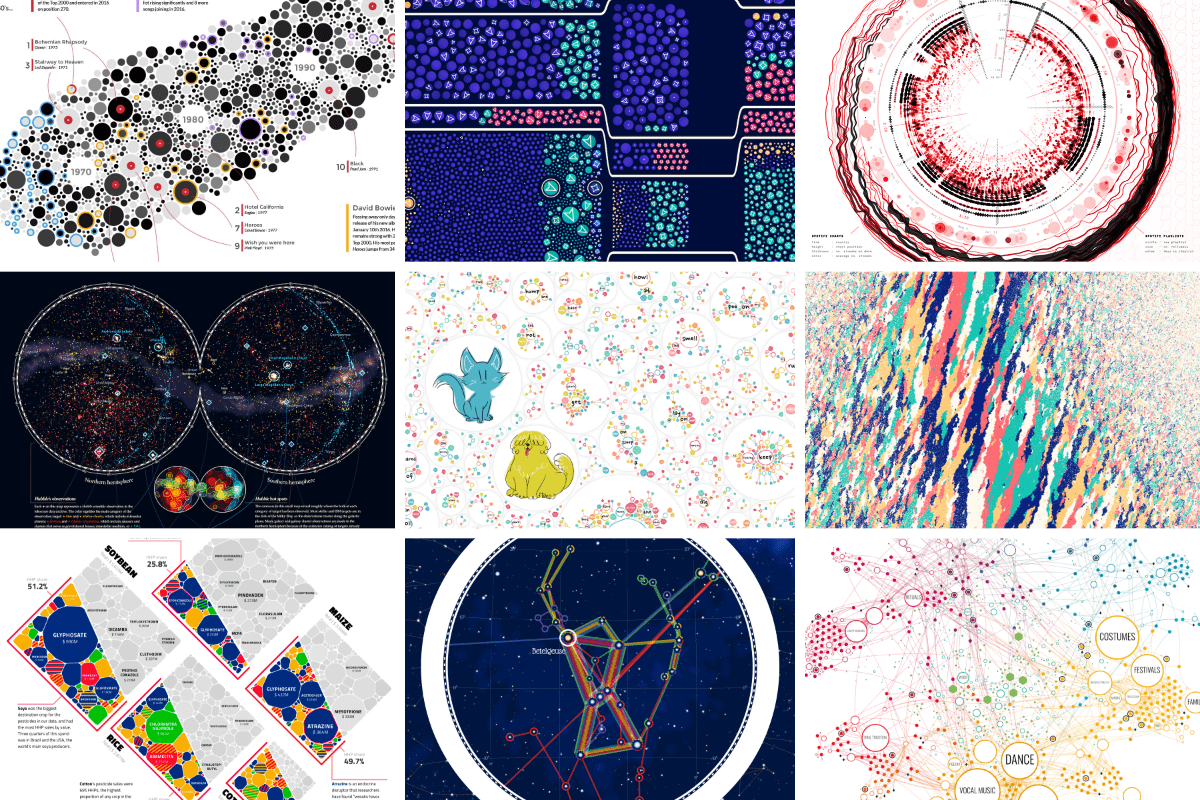
Defense Against Dishonest Charts
This is a guide to protect ourselves and to preserve what is good about turning data into visual things.
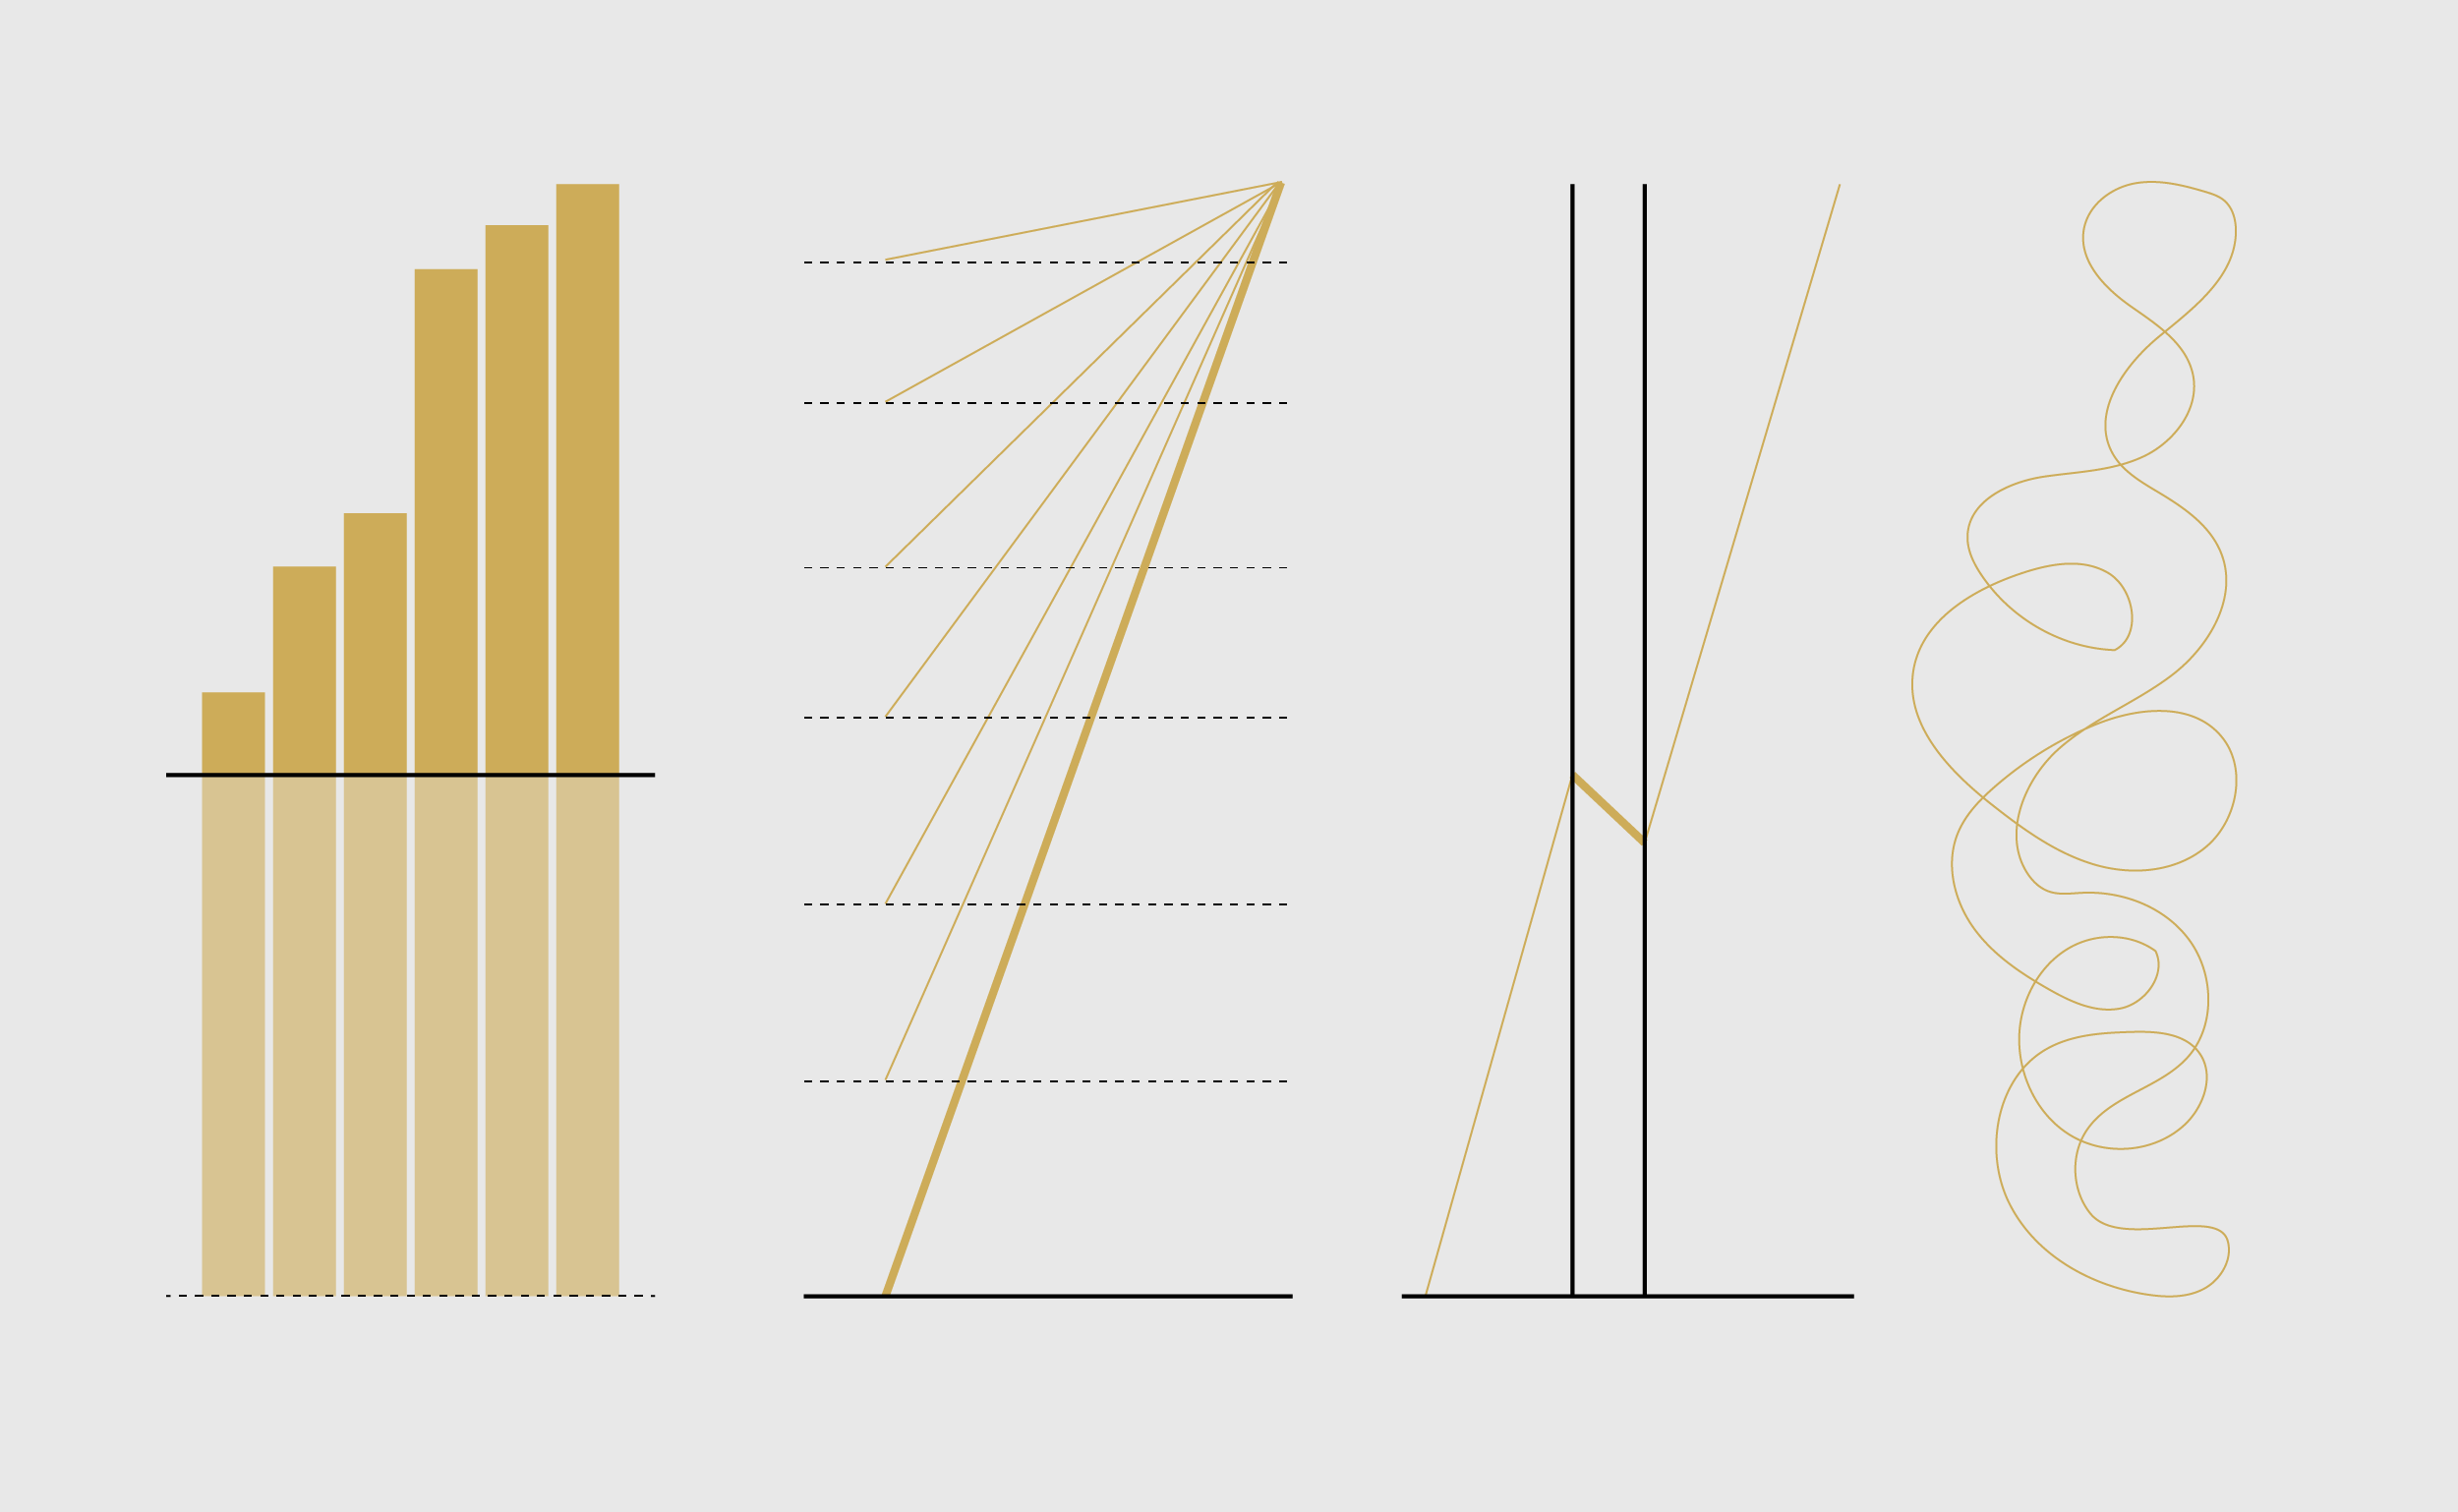
Beautiful Public Data
A curated selection of visually interesting datasets collected by local, state and federal government agencies. By @jonkeegan
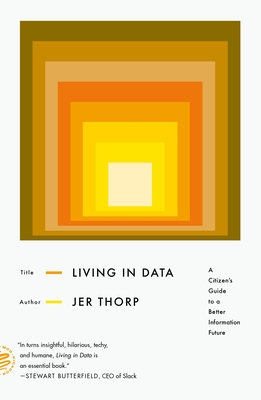
Living in Data: A Citizen's Guide to a Better Information Future (Paperback)
Jer Thorp’s analysis of the word “data” in 10,325 New York Times stories written between 1984 and 2018 shows a distinct trend: among the words most closely associated with “data,” we find not only its classic companions “information” and “digital,” but also a variety of new neighbors—from “scandal” and “misinformation” to “ethics,” “friends,” and “play.”To live in data in the twenty-first century

ELI5 : What exactly is Aesthetic Visual Analysis?
I am a designer and I recently read about Netflix using an image discovery tool called AVA to generate frames from the content on their platform…
Chart Design Principles | Hands-On Data Visualization
Tell your story and show it with data, using free and easy-to-learn tools on the web. This introductory book teaches you how to design interactive charts and customized maps for your website, beginning with easy drag-and-drop tools, such as Google Sheets, Datawrapper, and Tableau Public. You will also gradually learn how to edit open-source code templates built with Chart.js, Highcharts, and Leaflet on GitHub. Follow along with the step-by-step tutorials, real-world examples, and online resources. This book is ideal for students, non-profit organizations, small business owners, local governments, journalists, academics, or anyone who wants to tell their story and show the data. No coding experience is required.
Everything is miscellaneous : the power of the new digital disorder
Includes bibliographical references (p. [235]-257) and index; Prologue : information in space -- The new order of order -- Alphabetization and its discontents -- The geography of knowledge -- Lumps and splits -- The laws of the jungle -- Smart leaves -- Social knowing -- What nothing says -- Messiness as a virtue -- The work of knowledge -- Coda : misc; Philosopher Weinberger shows how the digital revolution is radically changing the way we make sense of our lives. Human beings constantly collect, label, and organize data--but today, the shift from the physical to the digital is mixing, burning, and ripping our lives apart. In the past, everything had its one place--the physical world demanded it--but now everything has its places: multiple categories, multiple shelves. Everything is suddenly miscellaneous. Weinberger charts the new principles of digital order that are remaking business, education, politics, science, and culture. He examines how Rand McNally decides what information not to include in a physical map (and why Google Earth is winning that battle), how Staples stores emulate online shopping to increase sales, why your children's teachers will stop having them memorize facts, and how the shift to digital music stands as the model for the future.--From publisher description; From A to Z, Everything Is Miscellaneous will completely reshape the way you think - and what you know - about the world. Includes information on alphabetical order, Amaxon.com, animals, Aristotle, authority, Bettmann Archive, blogs (weblogs), books, broadcasting, British Broadcasting Corporation (BBC), business, card catalog, categories and categorization, clusters, companies, Colon Classification, conversation, Melvil Dewey, Dewey Decimal Classification system, Encyclopaedia Britannica, encyclopedia, essentialism, experts, faceted classification system, first order of order, Flickr.com, Google, Great Books of the Western World, ancient Greeks, health and medical information, identifiers, index, inventory tracking, knowledge, labels, leaf and leaves, libraries, Library of Congress, links, Carolus Linnaeus, lumping and splitting, maps and mapping, marketing, meaning, metadata, multiple listing services (MLS), names of people, neutrality or neutral point of view, New York Public Library, Online Computer Library Center (OCLC), order and organization, people, physical space, everything having place, Plato, race, S.R. Ranganathan, Eleanor Rosch, Joshua Schacter, science, second order of order, simplicity, social constructivism, social knowledge, social networks, sorting, species, standardization, tags, taxonomies, third order of roder, topical categorization, tree, Uniform Product Code (UPC), users, Jimmy Wales, web, Wikipedia, etc

Search the world's information, including webpages, images, videos and more. Google has many special features to help you find exactly what you're looking for.
Search the world's information, including webpages, images, videos and more. Google has many special features to help you find exactly what you're looking for.
Search the world's information, including webpages, images, videos and more. Google has many special features to help you find exactly what you're looking for.
Google: Organize the world's information Atmosphere: Let the world's information self-organize

TJ
In some ways, atproto, bluesky, @semble.so, @sill.social, @standard.site and so on are building new indexes for the web. I really hope atproto succeeds and goes fully mainstream. Think of the amazing search engines that can be built on such rich index data. Maybe web3 can actually happen.

