


And if people think you can show anything you want with statistics, then this cynicism certainly applies to statistics graphs, too.
A Gentle Introduction To Graph Theory
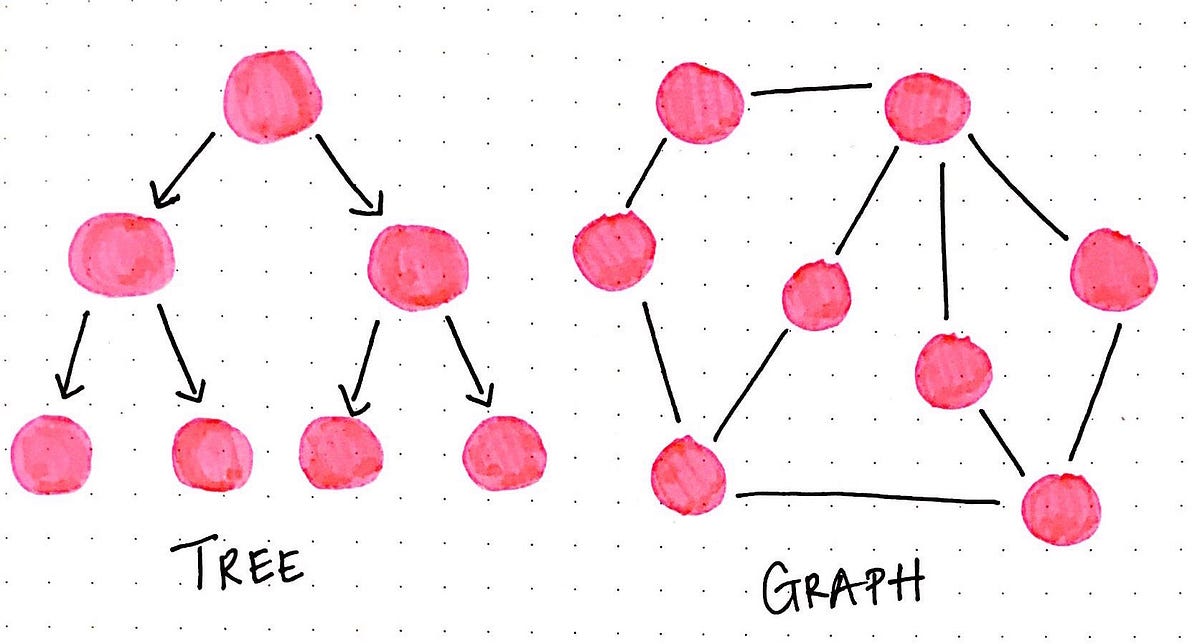
So many things in the world would have never come into existence if there hadn’t been a problem that needed solving. This truth applies to…
Brad's Thoughts on the Social Graph
I've been thinking a lot about the social graph for awhile now: aggregating the graph, decentralization, social network portability, etc.
The 34th International Symposium on Graph Drawing and Network Visualization
The 34th International Symposium on Graph Drawing and Network Visualization will be held at Brock University in St. Catharines, Ontario, Canada from August 17-21, 2026. A PhD school will take place on August 17-18, 2026.
Fruits - Graph All The Things
Fruits - Graph All The Things, a math blog by Martin Loncaric
The Graph That Should Be Front-Page News
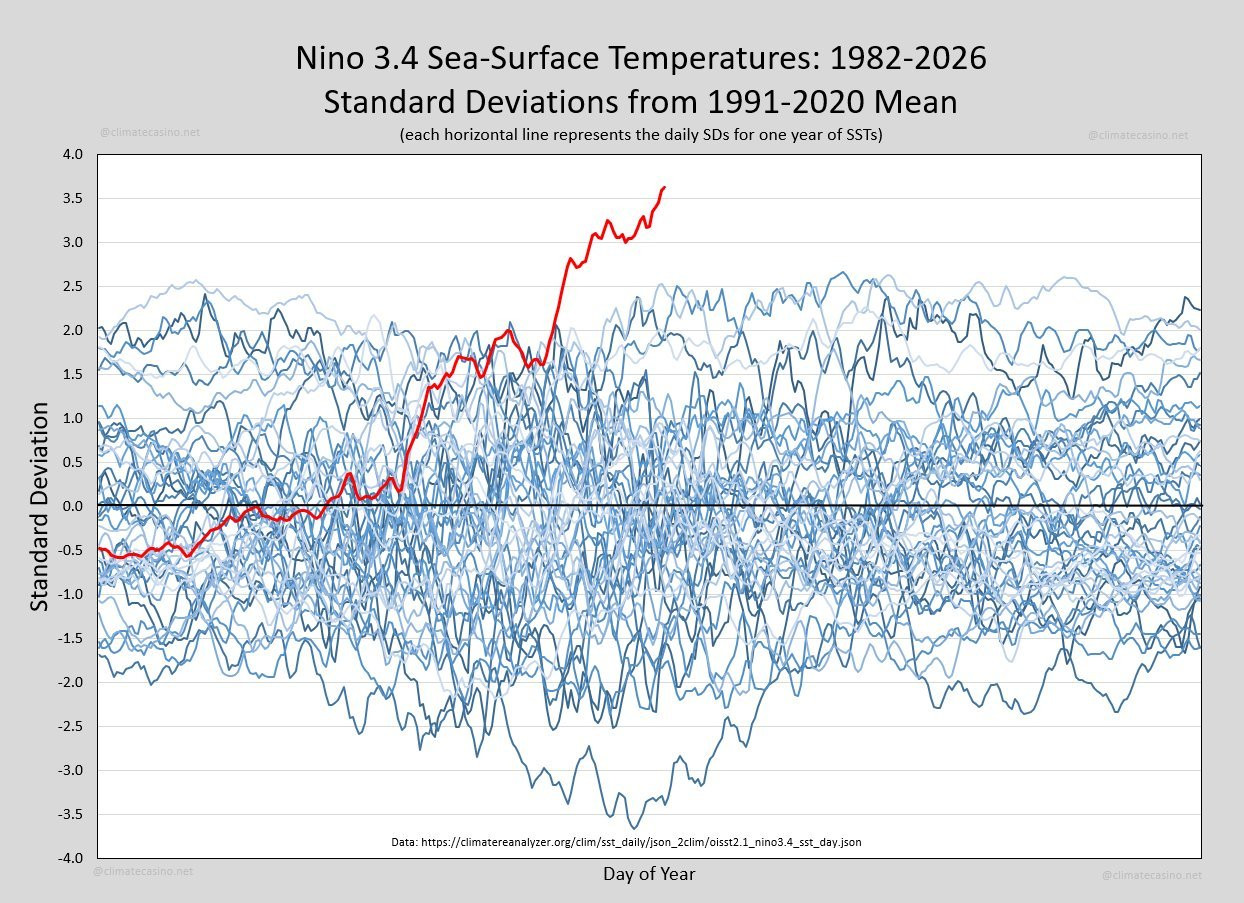
Every so often the Earth produces a signal that is impossible to ignore. This graph is one of them. It shows sea-surface temperatures in the Niño 3.4 region of the equatorial Pacific, one of the most important parts of the Earth's climate system. Each blue line represents a different year since 1982. The red line is this year. It doesn't just set a new record. It has departed entirely from the range of previous observations.If this graph represented stock market prices, a new Olympic record or a
Tim Berners-Lee, Giant Global Graph (2007)
A new vision for the web where the users master their data and link them to everybody's benefit in a giant global graph.
The "Majority Illusion" in Social Networks
Individual’s decisions, from what product to buy to whether to engage in risky behavior, often depend on the choices, behaviors, or states of other people. People, however, rarely have global knowledge of the states of others, but must estimate them from the local observations of their social contacts. Network structure can significantly distort individual’s local observations. Under some conditions, a state that is globally rare in a network may be dramatically over-represented in the local neighborhoods of many individuals. This effect, which we call the “majority illusion,” leads individuals to systematically overestimate the prevalence of that state, which may accelerate the spread of social contagions. We develop a statistical model that quantifies this effect and validate it with measurements in synthetic and real-world networks. We show that the illusion is exacerbated in networks with a heterogeneous degree distribution and disassortative structure.
Hive Plots - Linear Layout for Network Visualization - Visually Interpreting Network Structure and Content Made Possible
the hive plot is a perceptually uniform and scalable linear layout visualization for network visual analytics
Lab Notes #007: Semble Following - Cosmik Labs
The Cosmik Network social graph launches


