

Generate interactive plots with python
Matplotlib: A 2D Graphics Environment
Matplotlib is a 2D graphics package used for Python for application development, interactive scripting,and publication-quality image generation across user interfaces and operating systems
An AI Agent Published a Hit Piece on Me
Scott Shambaugh helps maintain the excellent and venerable matplotlib Python charting library, including taking on the thankless task of triaging and reviewing incoming pull requests. A GitHub account called @crabby-rathbun …
12 Python Data Visualization Libraries to Explore for Business Analysis | Mode
This list is an overview of 10 interdisciplinary Python data visualization libraries including matplotlib, Seaborn, Plotly, Bokeh, pygal, geoplotlib, & more.
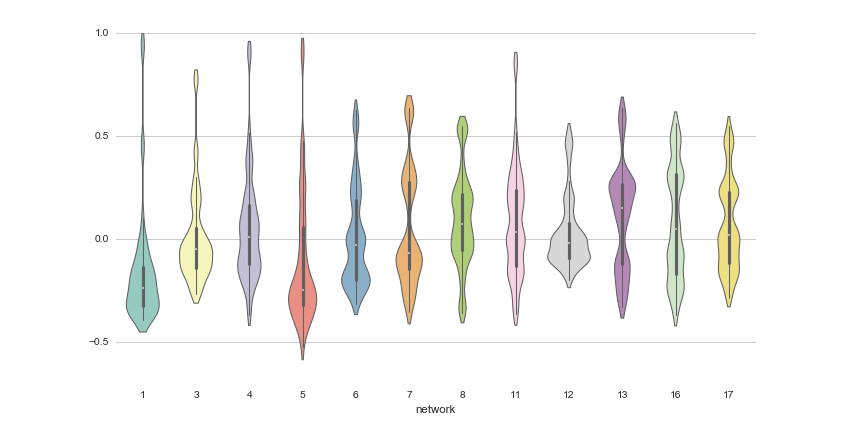
Comparison of plotting packages
I want to write a small 2d physical simulation to sharpen my Julia skills and learn how to use Julia to display more than “regular plots” I saw a post suggesting using either Makie, Plots or Javis I don’t want to start a fan war but would appreciate a comparison of the different use cases where each of the packages shines and where it can be challenging to use

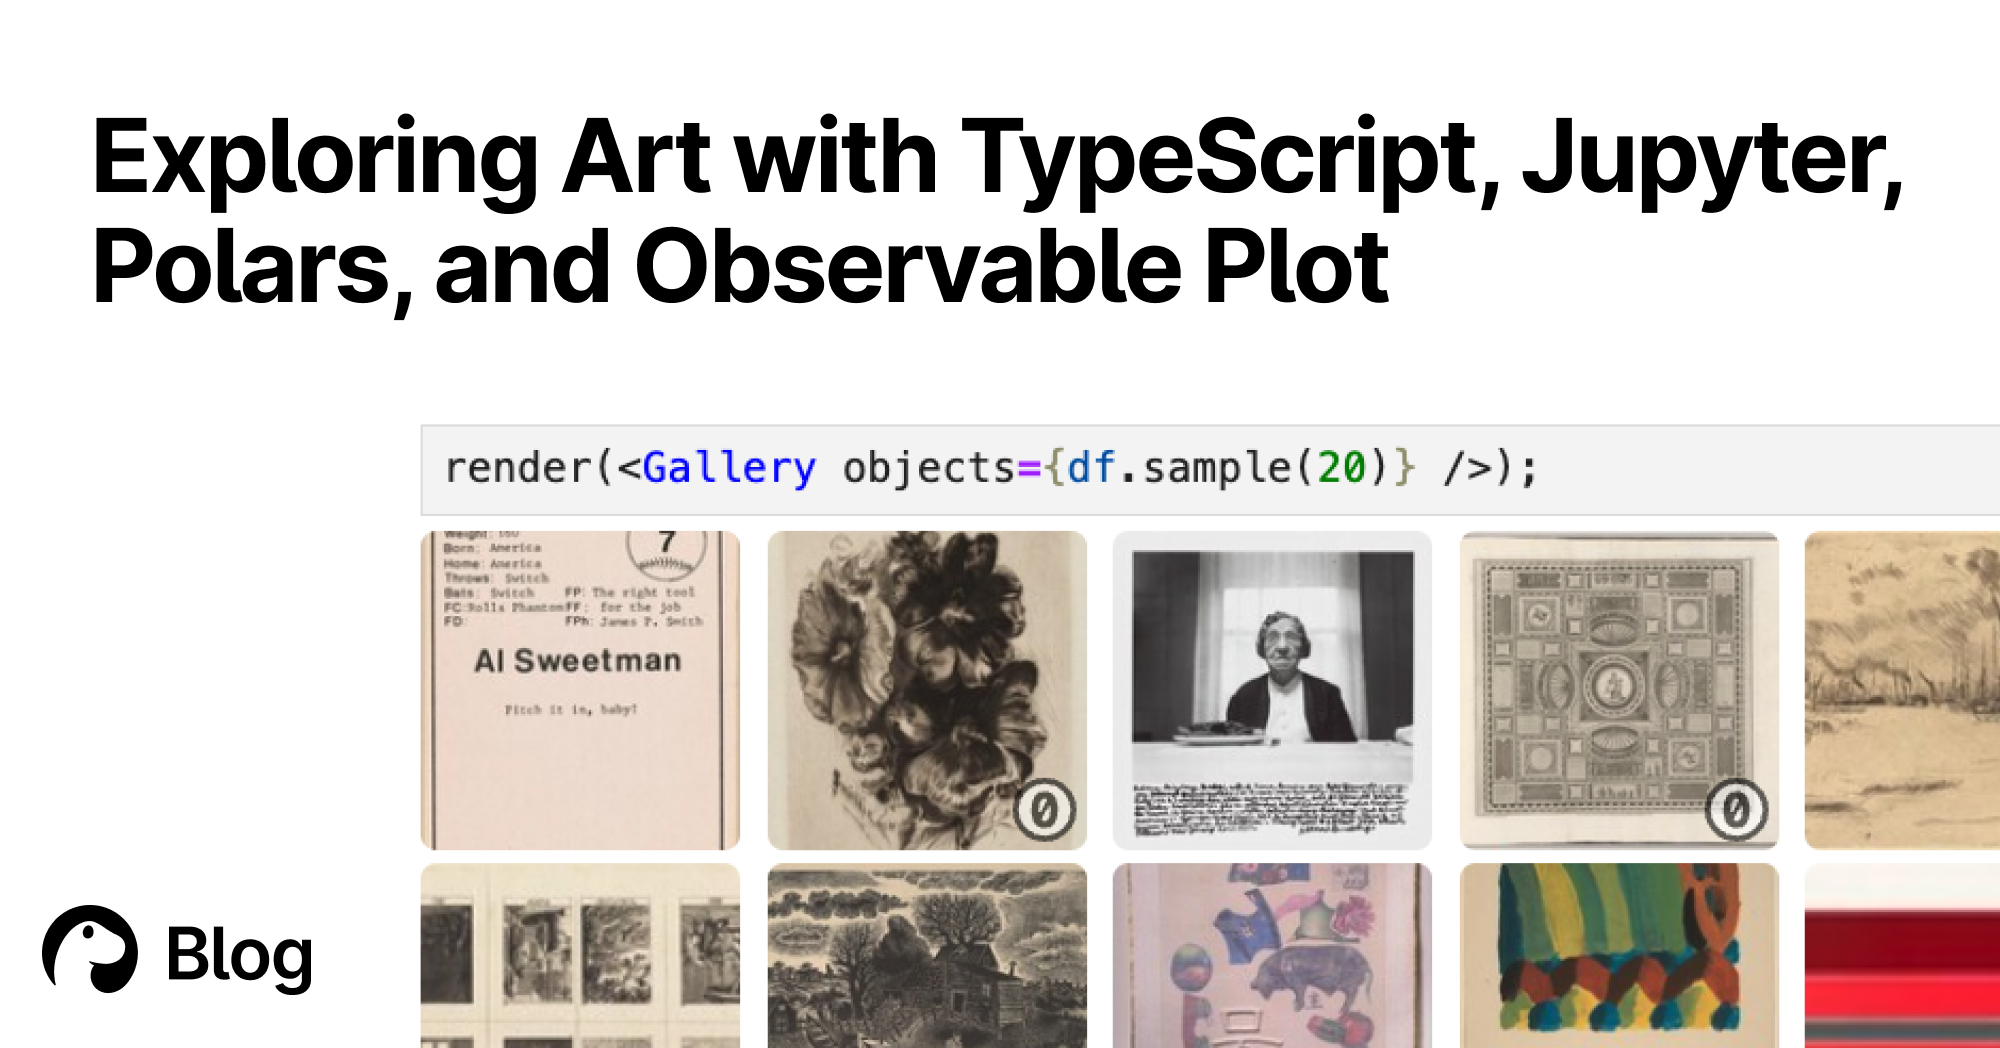
Exploring Art with TypeScript, Jupyter, Polars, and Observable Plot | Deno
With Deno's Jupyter support, you can explore, interact, and create interactive charts with TypeScript and HTML. Here's a tutorial featuring data of over 130,000 famous artworks.
A simple way of visualizing git repository
Some time ago, a new colleague joined our department and started working on a platform we provide. During his initial days, I noticed he was using an interactive Python shell to create treemap visualizations of the project's git history.
marimo | a next-generation Python notebook
Explore data and build apps seamlessly with marimo, a next-generation Python notebook.
Python Tutorial | Learn Python Programming Language - GeeksforGeeks
Your All-in-One Learning Portal: GeeksforGeeks is a comprehensive educational platform that empowers learners across domains-spanning computer science and programming, school education, upskilling, commerce, software tools, competitive exams, and more.

WRKSHP.tools | Storytelling Canvas
Create better stories and presentations in under 45 minutes using the Storytelling Canvas
SciPy 1.0: fundamental algorithms for scientific computing in Python
SciPy is an open-source scientific computing library for the Python programming language. Since its initial release in 2001, SciPy has become a de facto standard for leveraging scientific algorithms in Python, with over 600 unique code contributors, thousands of dependent packages, over 100,000 dependent repositories and millions of downloads per year. In this work, we provide an overview of the capabilities and development practices of SciPy 1.0 and highlight some recent technical developments.

Fundamentals of Interactivity | Interactive Storytelling Tools for Writers | Chris Crawford
Pydata Paris Virtual Meetup June 2021