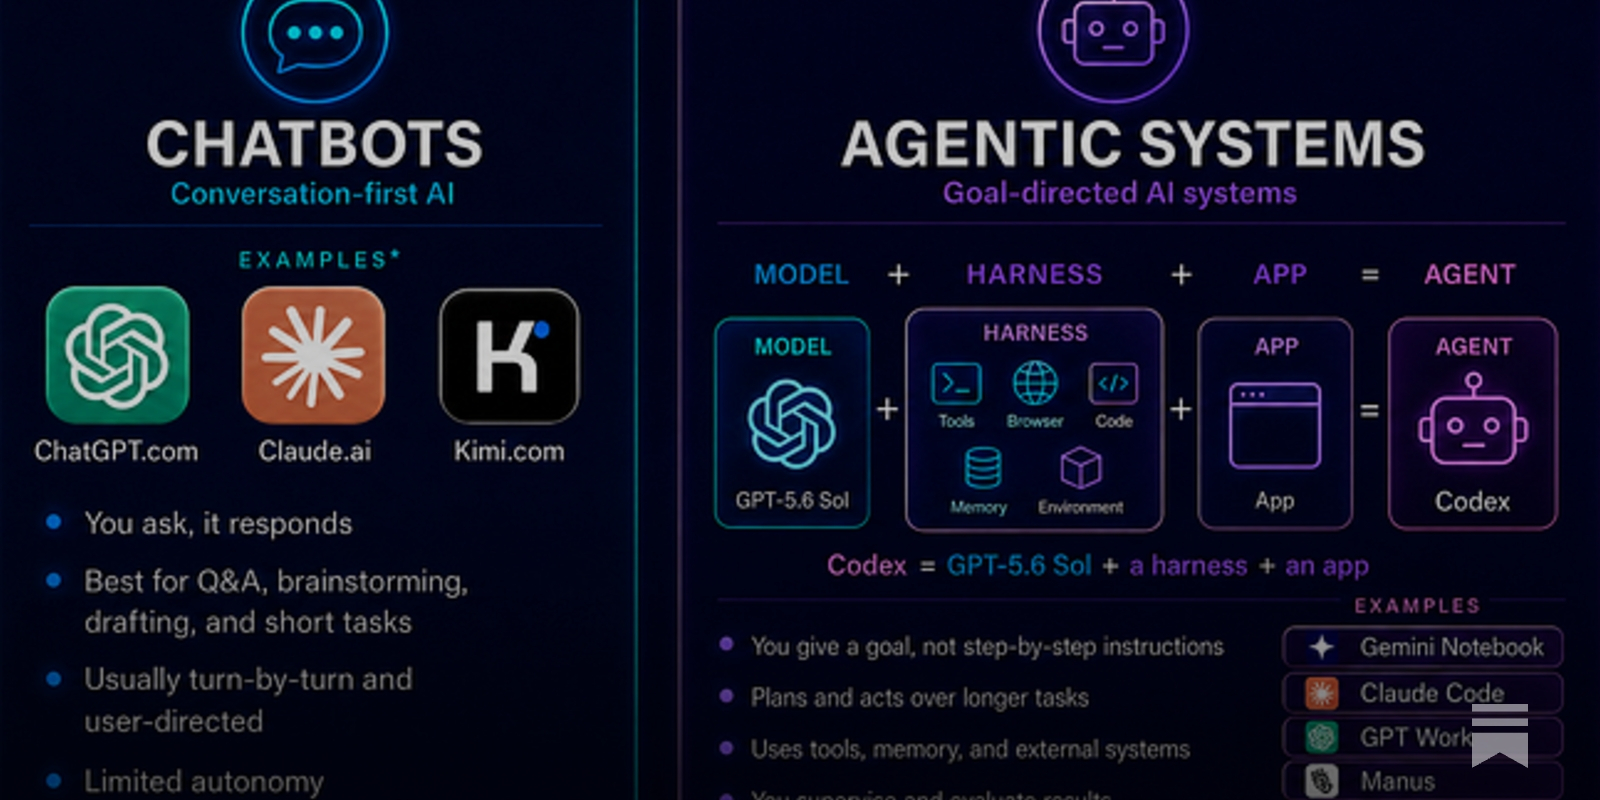
Agent Economies | Interactive AI Network Visualization
Explore the future of AI agent economies through an interactive network visualization representing autonomous systems that collaborate and evolve.
Meet Foundry: An AI Startup that Builds, Evaluates, and Improves AI Agents

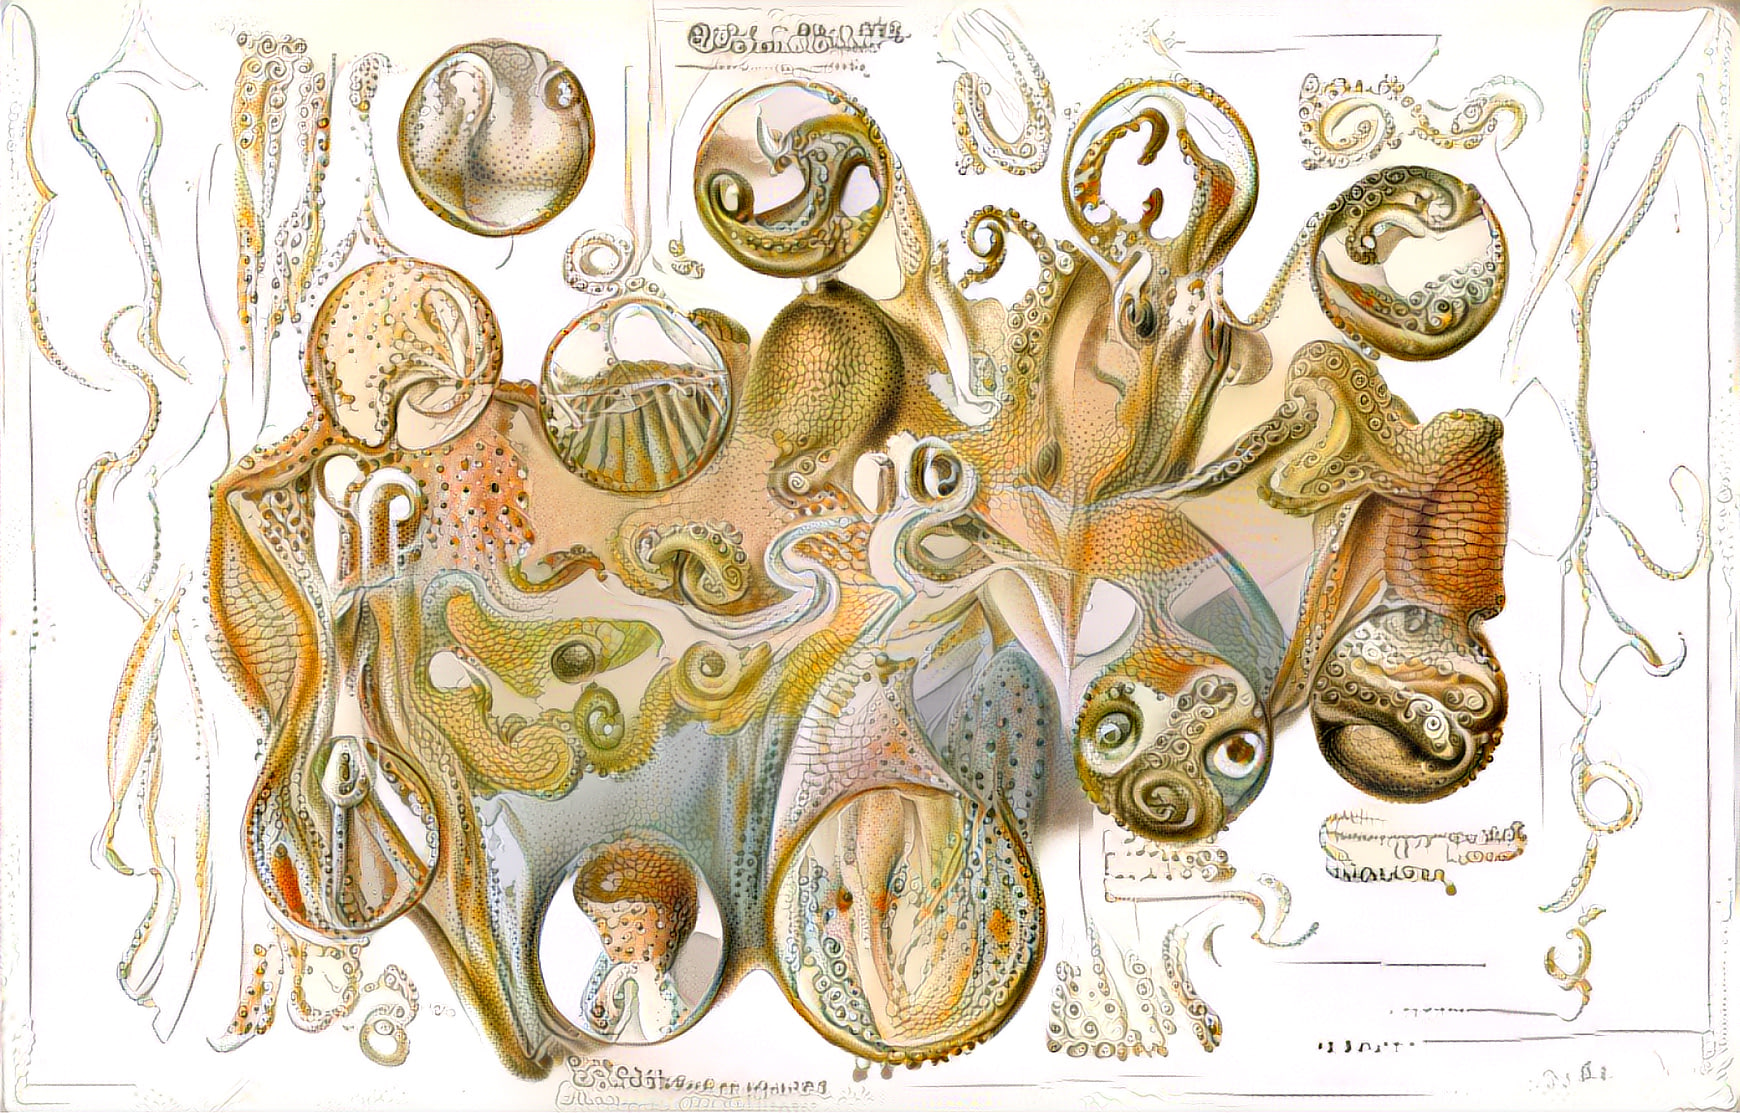
More Than a Tool
What We Learned from a Year of Conversations About AI
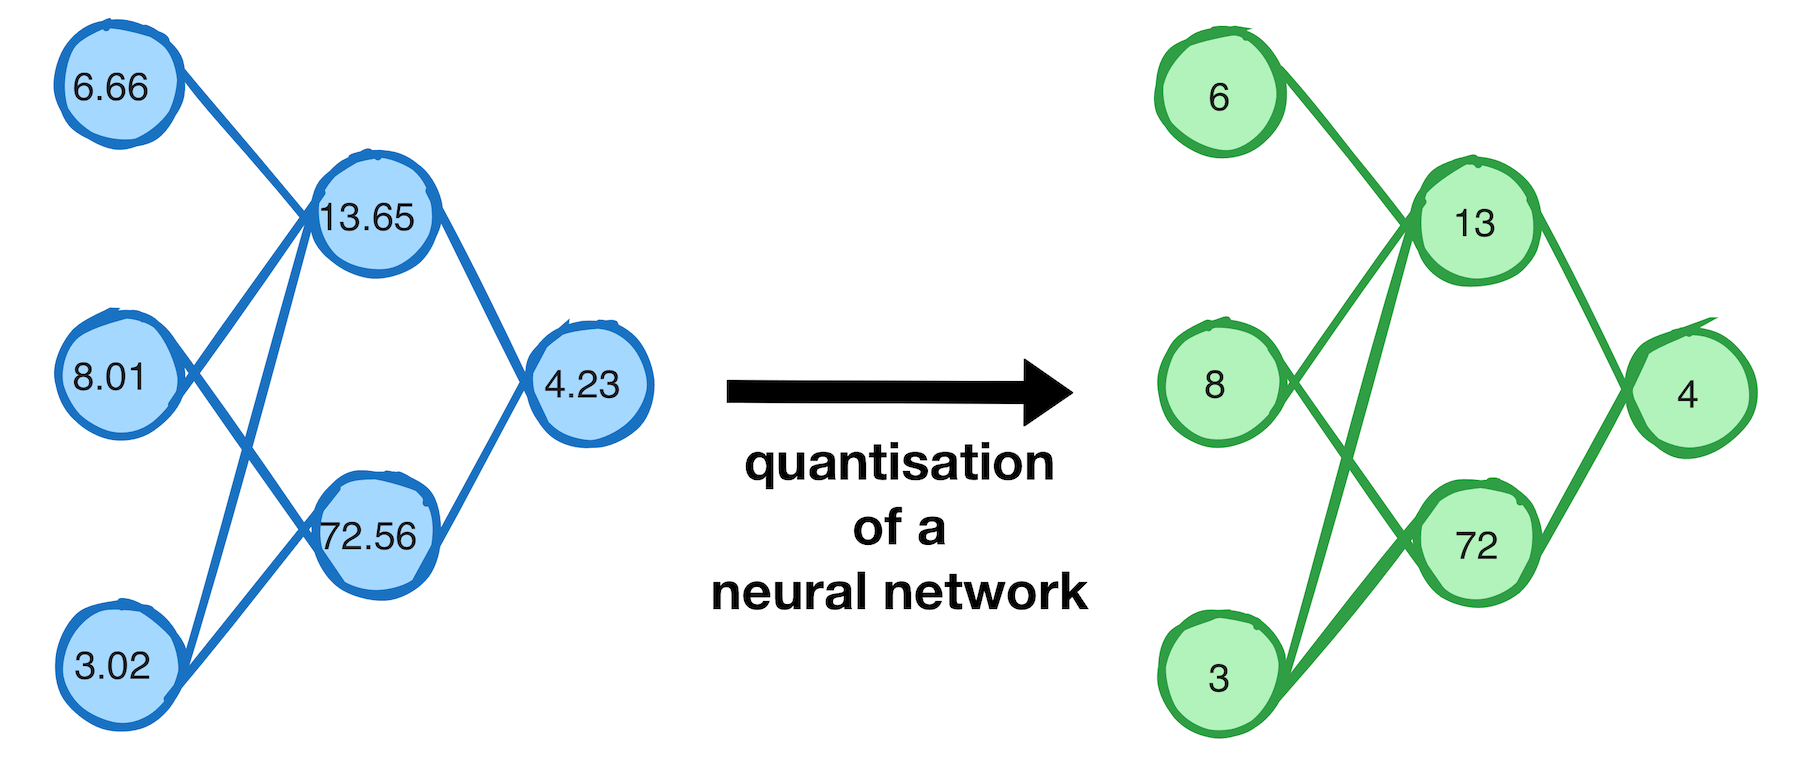
Understanding AI/LLM Quantisation Through Interactive Visualisations
AI/LLM Quantisation Visualised
The Scaling Era: An Oral History of AI, 2019–2025
An inside view of the AI revolution, from the people an…
On AI and building your own GIS software
Of the thousands of essays over the past two years surrounding AI and its implications are some very thought provoking ones with enormous implications for GIS. Some of the essays are around the the…

bytedance/UI-TARS-desktop
The Open-Source Multimodal AI Agent Stack: Connecting Cutting-Edge AI Models and Agent Infra
We built the GUI for AI - agentic workflows now have a canvas
232 votes, 50 comments. So we built something different: A canvas-based browser interface where you can visually organize, run, and monitor…
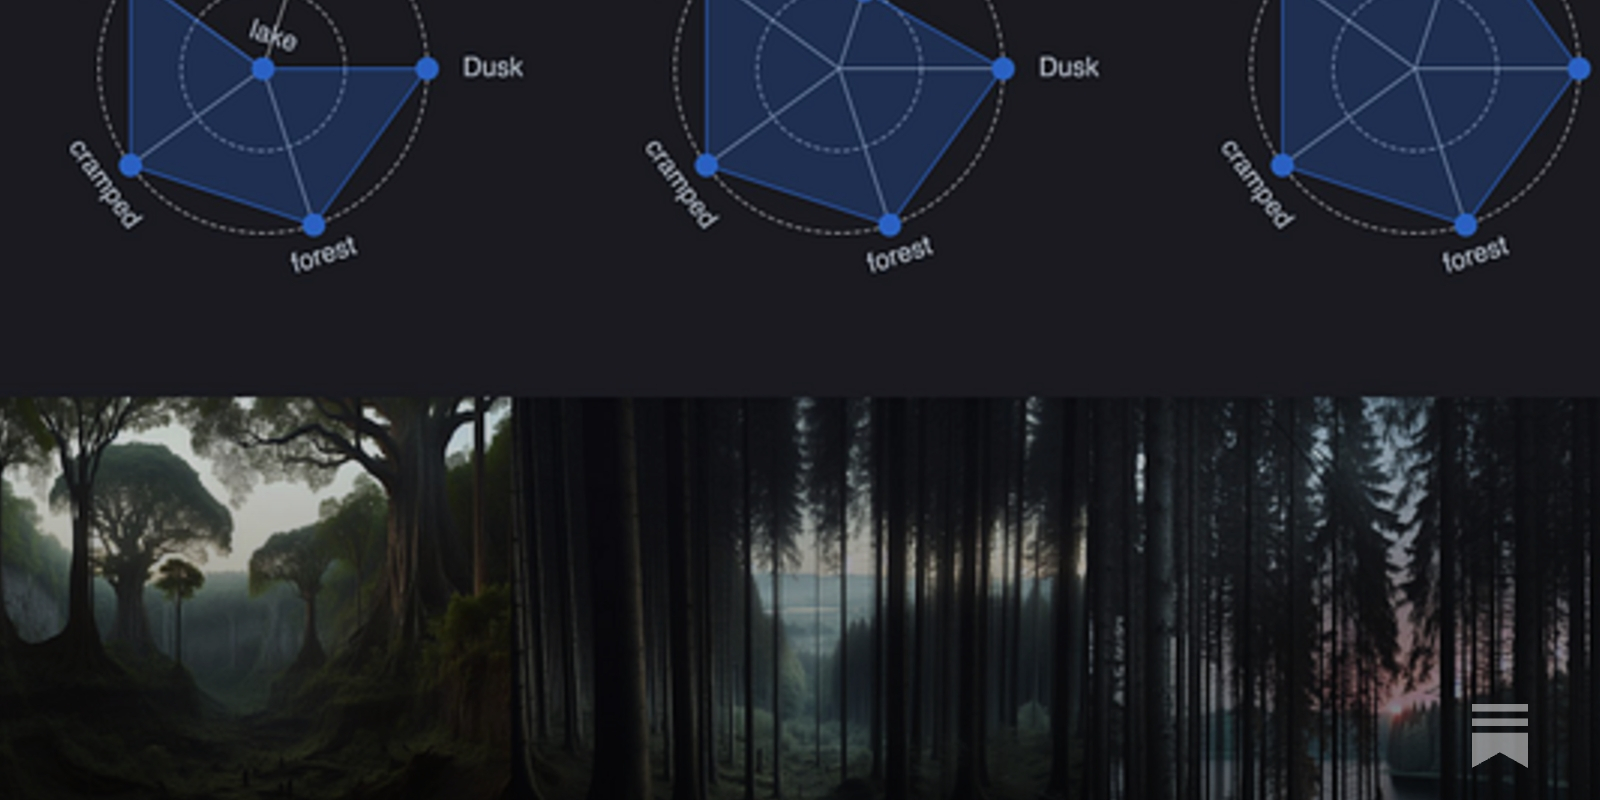
What Would A Serious AI Product Look Like?
Every “AI” tool is missing critical features that you would need if you wanted to do real work with them. What would those look like, if they existed?

AI Index | Stanford HAI
The mission of the AI Index is to provide unbiased, rigorously vetted, and globally sourced data for policymakers, researchers, journalists, executives, and the general public to develop a deeper understanding of the complex field of AI. To achieve this, we track, collate, distill, and visualize dat

visualising data structures and algorithms through animation - VisuAlgo
VisuAlgo was conceptualised in 2011 by Associate Professor Steven Halim (NUS School of Computing) as a tool to help his students better understand data structures and algorithms, by allowing them to learn the basics on their own and at their own pace. Together with his students from the National University of Singapore, a series of visualizations were developed and consolidated, from simple sorting algorithms to complex graph data structures. Though specifically designed for the use of NUS students taking various data structure and algorithm classes (CS1010/equivalent, CS2040/equivalent (inclusive of IT5003)), CS3230, CS3233, and CS4234), as advocators of online learning, we hope that curious minds around the world will find these visualizations useful as well.
Monitor | Parallel | Parallel Web Systems | Infrastructure for intelligence on the web
Monitor API for AI agents.

Developers should be aware of these two AI engineering approaches | daily.dev
Two emerging engineering practices for building reliable AI agentic systems are introduced: Graph Engineering, which breaks work into smaller connected tasks...