

I present clearly, connect broadly, spark imagination and encourage enthusiasm for inquiry and explanation. I create visuals with analytical clarity and artistic dimensions.
On power, aesthetics, materiality and change in data visualization
Notes from the Information+ Conference at MIT/Northeastern University, Boston.
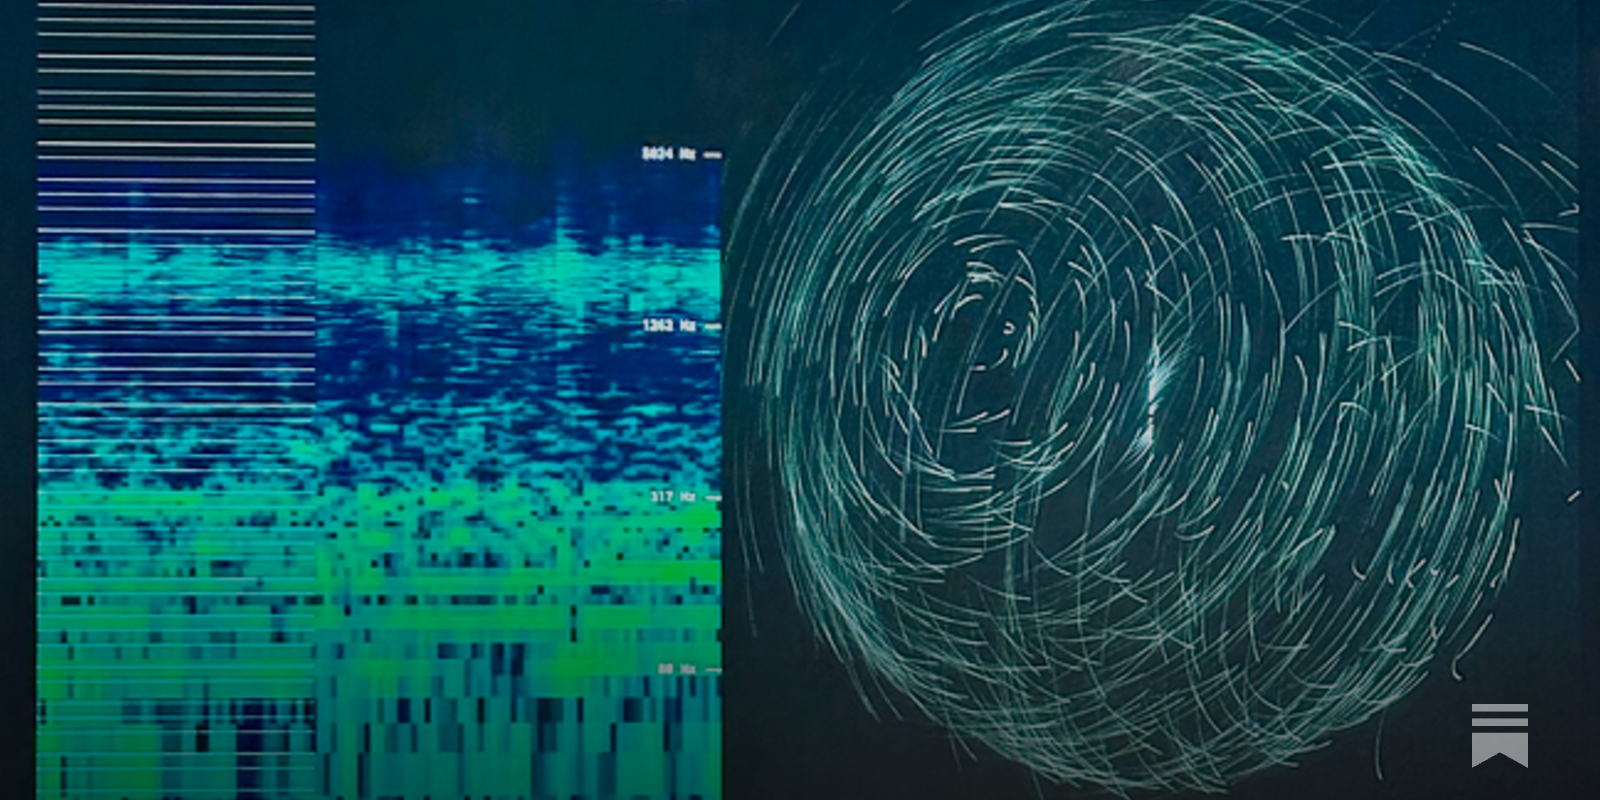
A checklist for designing and improving the visualization of scientific data
Creating clear and engaging scientific figures is crucial to communicate complex data. In this Comment, I condense principles from design, visual perception and data visualization research in a checklist that can help researchers to improve their data visualization, by focusing on clarity, accessibility and design best practices.
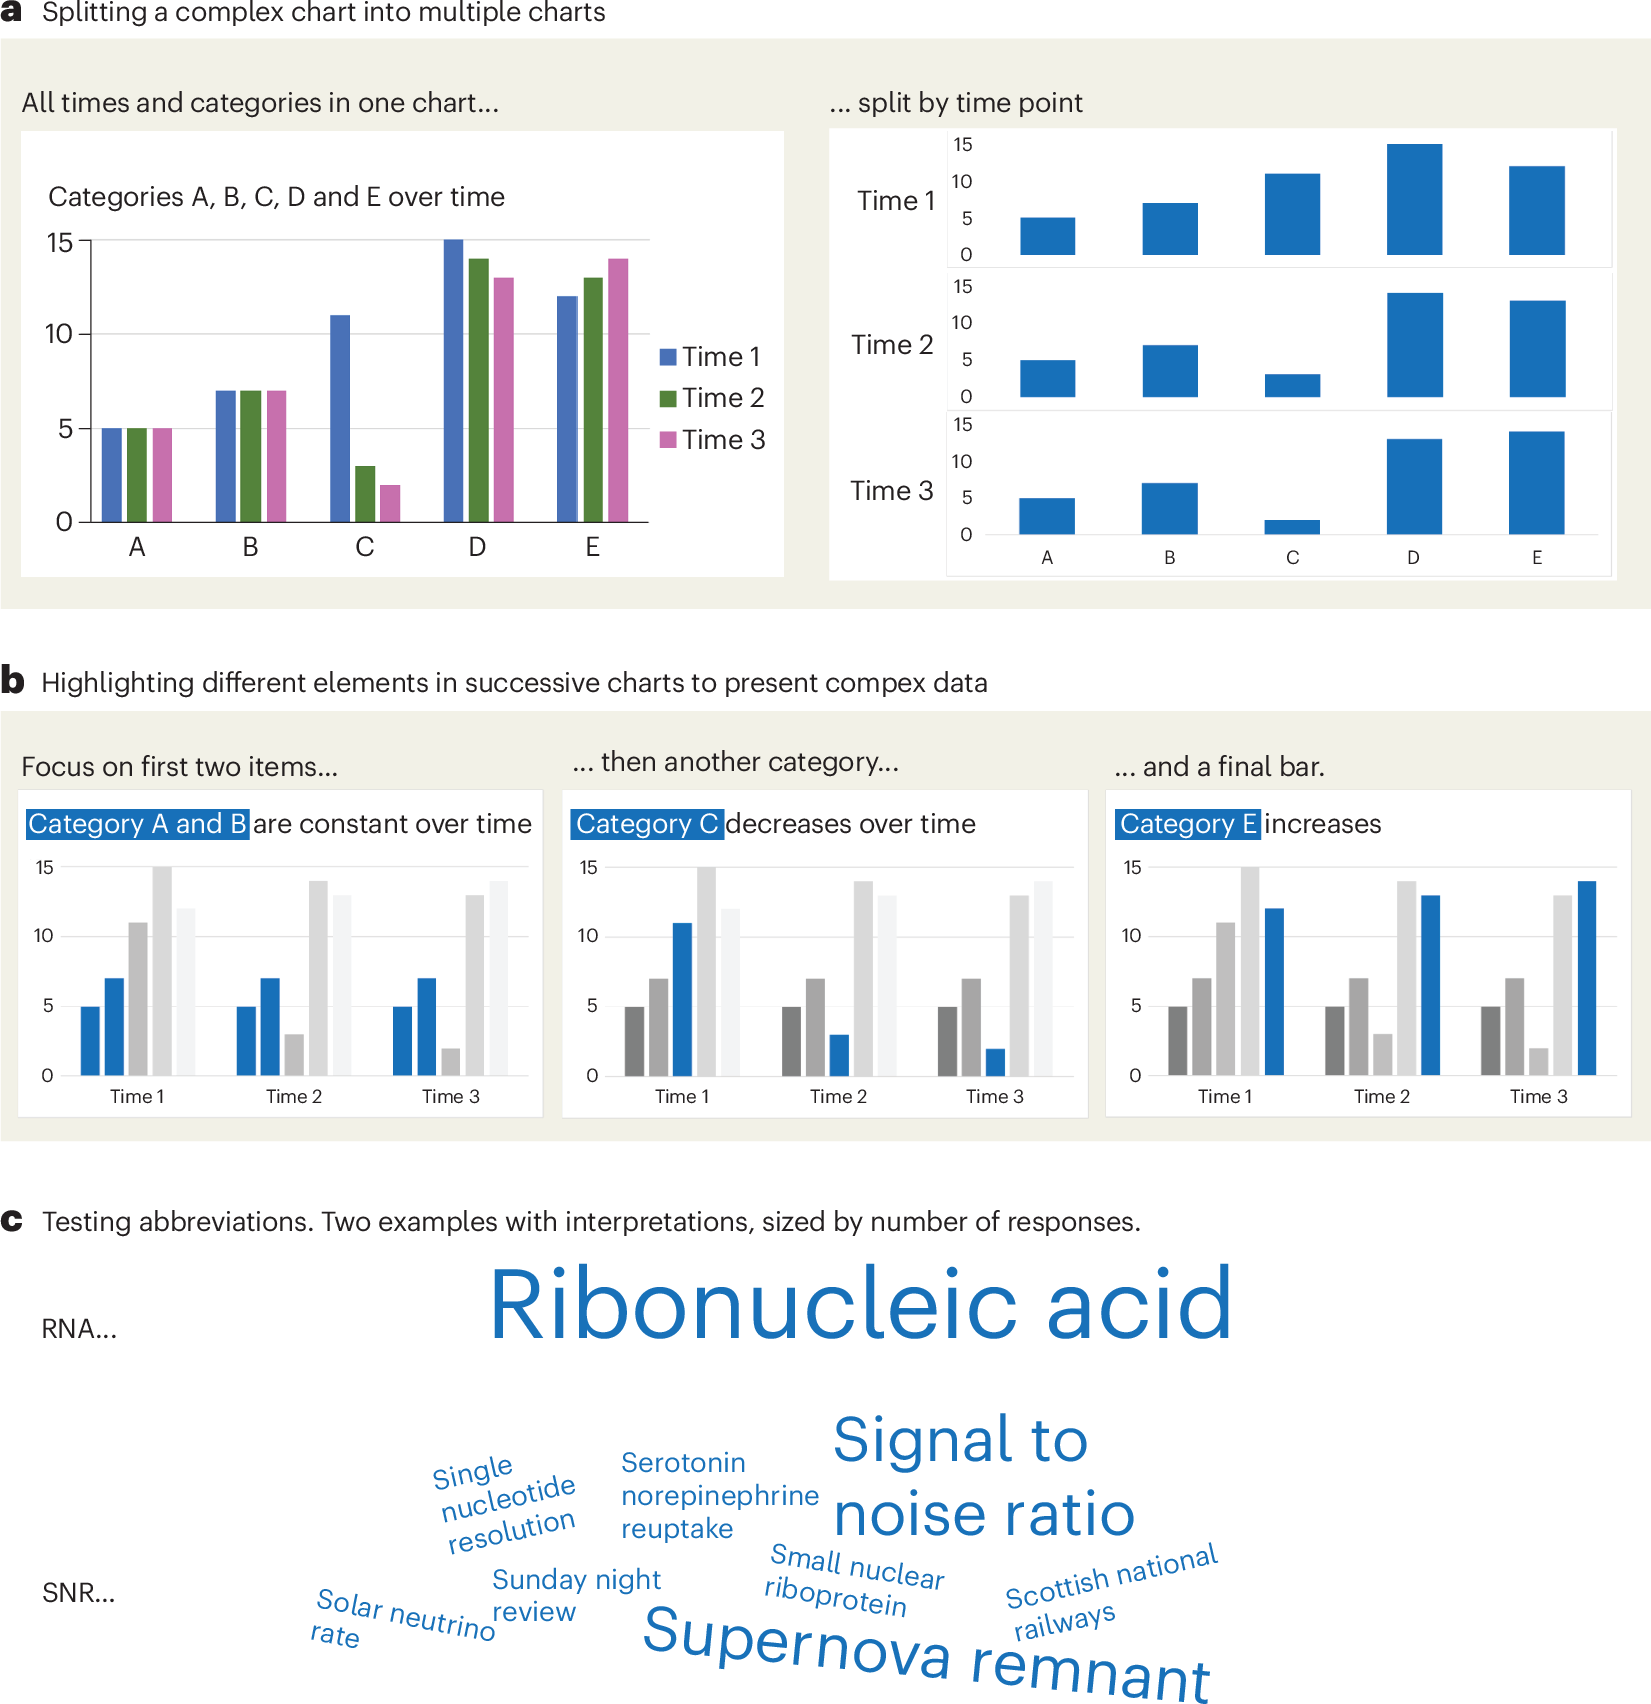
How Life Works: A User’s Guide to the New Biology
“Bold and intriguing.”—Wall Street Journal • “Penetrating. . . . Provocative and profound.”—Publishers Weekly (starred review) • “Offers plenty of food for thought.”—Kirkus Reviews (starred review) “Ball’s marvelous book is both wide-ranging and deep. . . . I could not put it down.”—Siddhartha Mukherjee, author of The Song of the Cell and the Pulitzer Prize–winning The Emperor of All Maladies A new, cutting-edge vision of biology that revises our understanding of what life itself is, how to enhance it, and what possibilities it offers. Biology is undergoing a quiet but profound transformation. Several aspects of the standard picture of how life works—the idea of the genome as a blueprint, of genes as instructions for building an organism, of proteins as precisely tailored molecular machines, of cells as entities with fixed identities, and more—have been exposed as incomplete, misleading, or wrong. In How Life Works, Philip Ball explores the new biology, revealing life to be a far richer, more ingenious affair than we had guessed. Ball explains that there is no unique place to look for an answer to this question: life is a system of many levels—genes, proteins, cells, tissues, and body modules such as the immune system and the nervous system—each with its own rules and principles. How Life Works explains how these levels operate, interface, and work together (most of the time). With this knowledge come new possibilities. Today we can redesign and reconfigure living systems, tissues, and organisms. We can reprogram cells, for instance, to carry out new tasks and grow into structures not seen in the natural world. As we discover the conditions that dictate the forms into which cells organize themselves, our ability to guide and select the outcomes becomes ever more extraordinary. Some researchers believe that ultimately we will be able to regenerate limbs and organs, and perhaps even create new life forms that evolution has never imagined. Incorporating the latest research and insights, How Life Works is a sweeping journey into this new frontier of the life sciences, a realm that will reshape our understanding of life as we know it.

Cytoscape: An Open Source Platform for Complex Network Analysis and Visualization
Cytoscape Official Web Site
Meet Rosalind Workbench: Empowering every scientist to be their own research team | OpenAI Developers
How guided tasks, scientific viewers, and sequencing analysis help researchers follow a question from data to evidence.
Information is Beautiful
Distilling the world's data, information & knowledge into beautiful infographics & visualizations

Prof. Judy Fan: Cognitive Tools for Making the Invisible Visible
Prof. Judy Fan: Cognitive Tools for Making the Invisible Visible
Data Scientist: The Sexiest Job of the 21st Century
Back in the 1990s, computer engineer and Wall Street “quant” were the hot occupations in business. Today data scientists are the hires firms are competing to make. As companies wrestle with unprecedented volumes and types of information, demand for these experts has raced well ahead of supply. Indeed, Greylock Partners, the VC firm that backed Facebook and LinkedIn, is so worried about the shortage of data scientists that it has a recruiting team dedicated to channeling them to the businesses in its portfolio. Data scientists are the key to realizing the opportunities presented by big data. They bring structure to it, find compelling patterns in it, and advise executives on the implications for products, processes, and decisions. They find the story buried in the data and communicate it. And they don’t just deliver reports: They get at the questions at the heart of problems and devise creative approaches to them. One data scientist who was studying a fraud problem, for example, realized it was analogous to a type of DNA sequencing problem. Bringing those disparate worlds together, he crafted a solution that dramatically reduced fraud losses. In this article, Harvard Business School’s Davenport and Greylock’s Patil take a deep dive on what organizations need to know about data scientists: where to look for them, how to attract and develop them, and how to spot a great one.

Cosmograph: Beautiful Visualization and Analytics | Cosmograph
Beautiful Visualization and Analytics

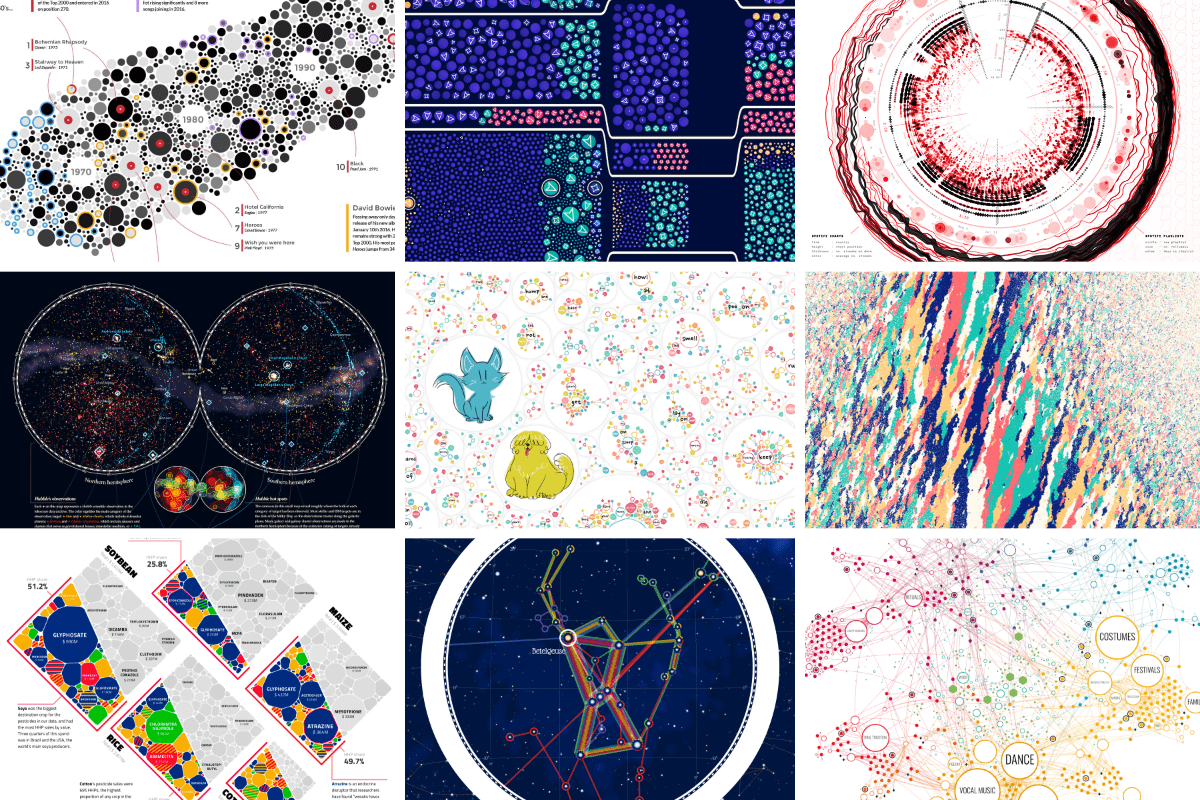
An Award-winning Data Visualization Designer
Visual Cinnamon | Data Visualization Design & Data Art | Data made insightful, effective & beautiful through data visualization and data art
Getting Started with Claude Code: A Researcher’s Setup Guide
Video 1 in a series on Claude Code
Manuscript — an imagined editor for research writing
A walk through an imagined product for academic writing, mocked up by Claude Design.
Built with Claude: Life Sciences – Cerebral Valley
Tuesday, Jul 7, 2026 · Remote: Built with Claude: Life Sciences will bring together researchers, clinicians, and biotech builders for a week-long hackathon in…