


An Observable notebook by Mike Bostock
GitHub - observablehq/plot: A concise API for exploratory data visualization implementing a layered grammar of graphics
A concise API for exploratory data visualization implementing a layered grammar of graphics - observablehq/plot
Observable
Observable notebooks are lightweight documents that let you think, explore, and explain with code. Quick to sketch and infinitely flexible, use them to analyze or visualize data, craft beautiful explanations, and support data-driven workflows with custom apps.
Introducing Observable Canvases
A new way to explore, visualize, and collaborate with data — all in one shared canvas.
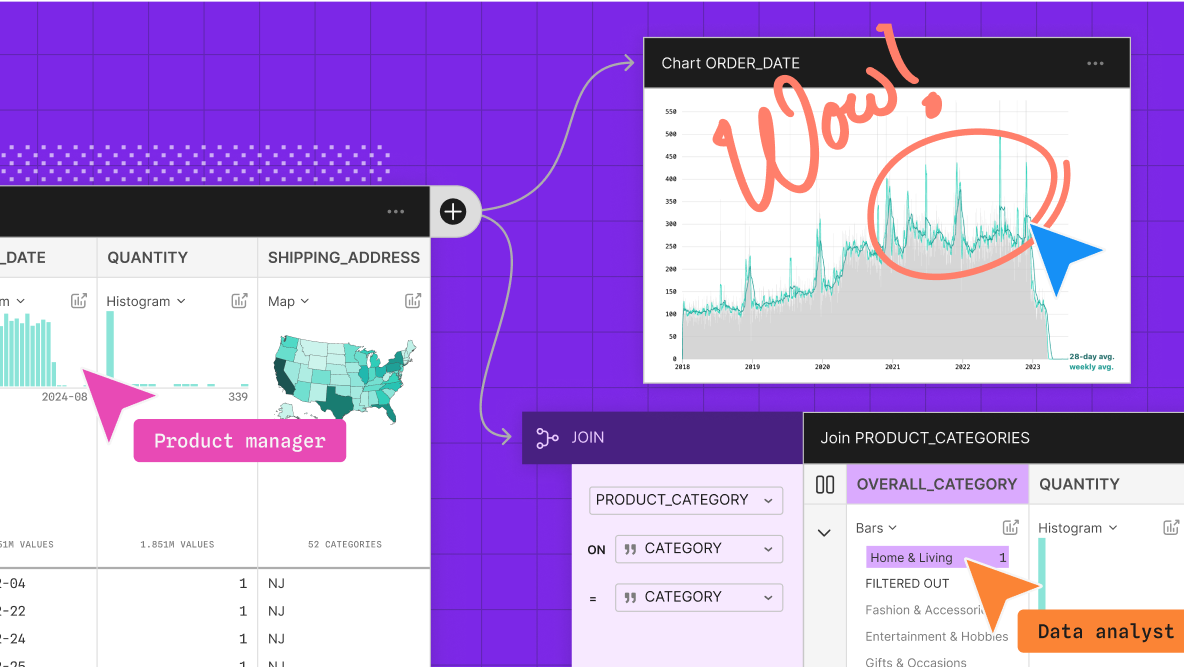
Observable Canvases | Explore and visualize data together
Observable’s collaborative data canvas helps you explore data, perform analysis, and build expressive charts and dashboards.
Cosmograph: Beautiful Visualization and Analytics | Cosmograph
Beautiful Visualization and Analytics

On power, aesthetics, materiality and change in data visualization
Notes from the Information+ Conference at MIT/Northeastern University, Boston.
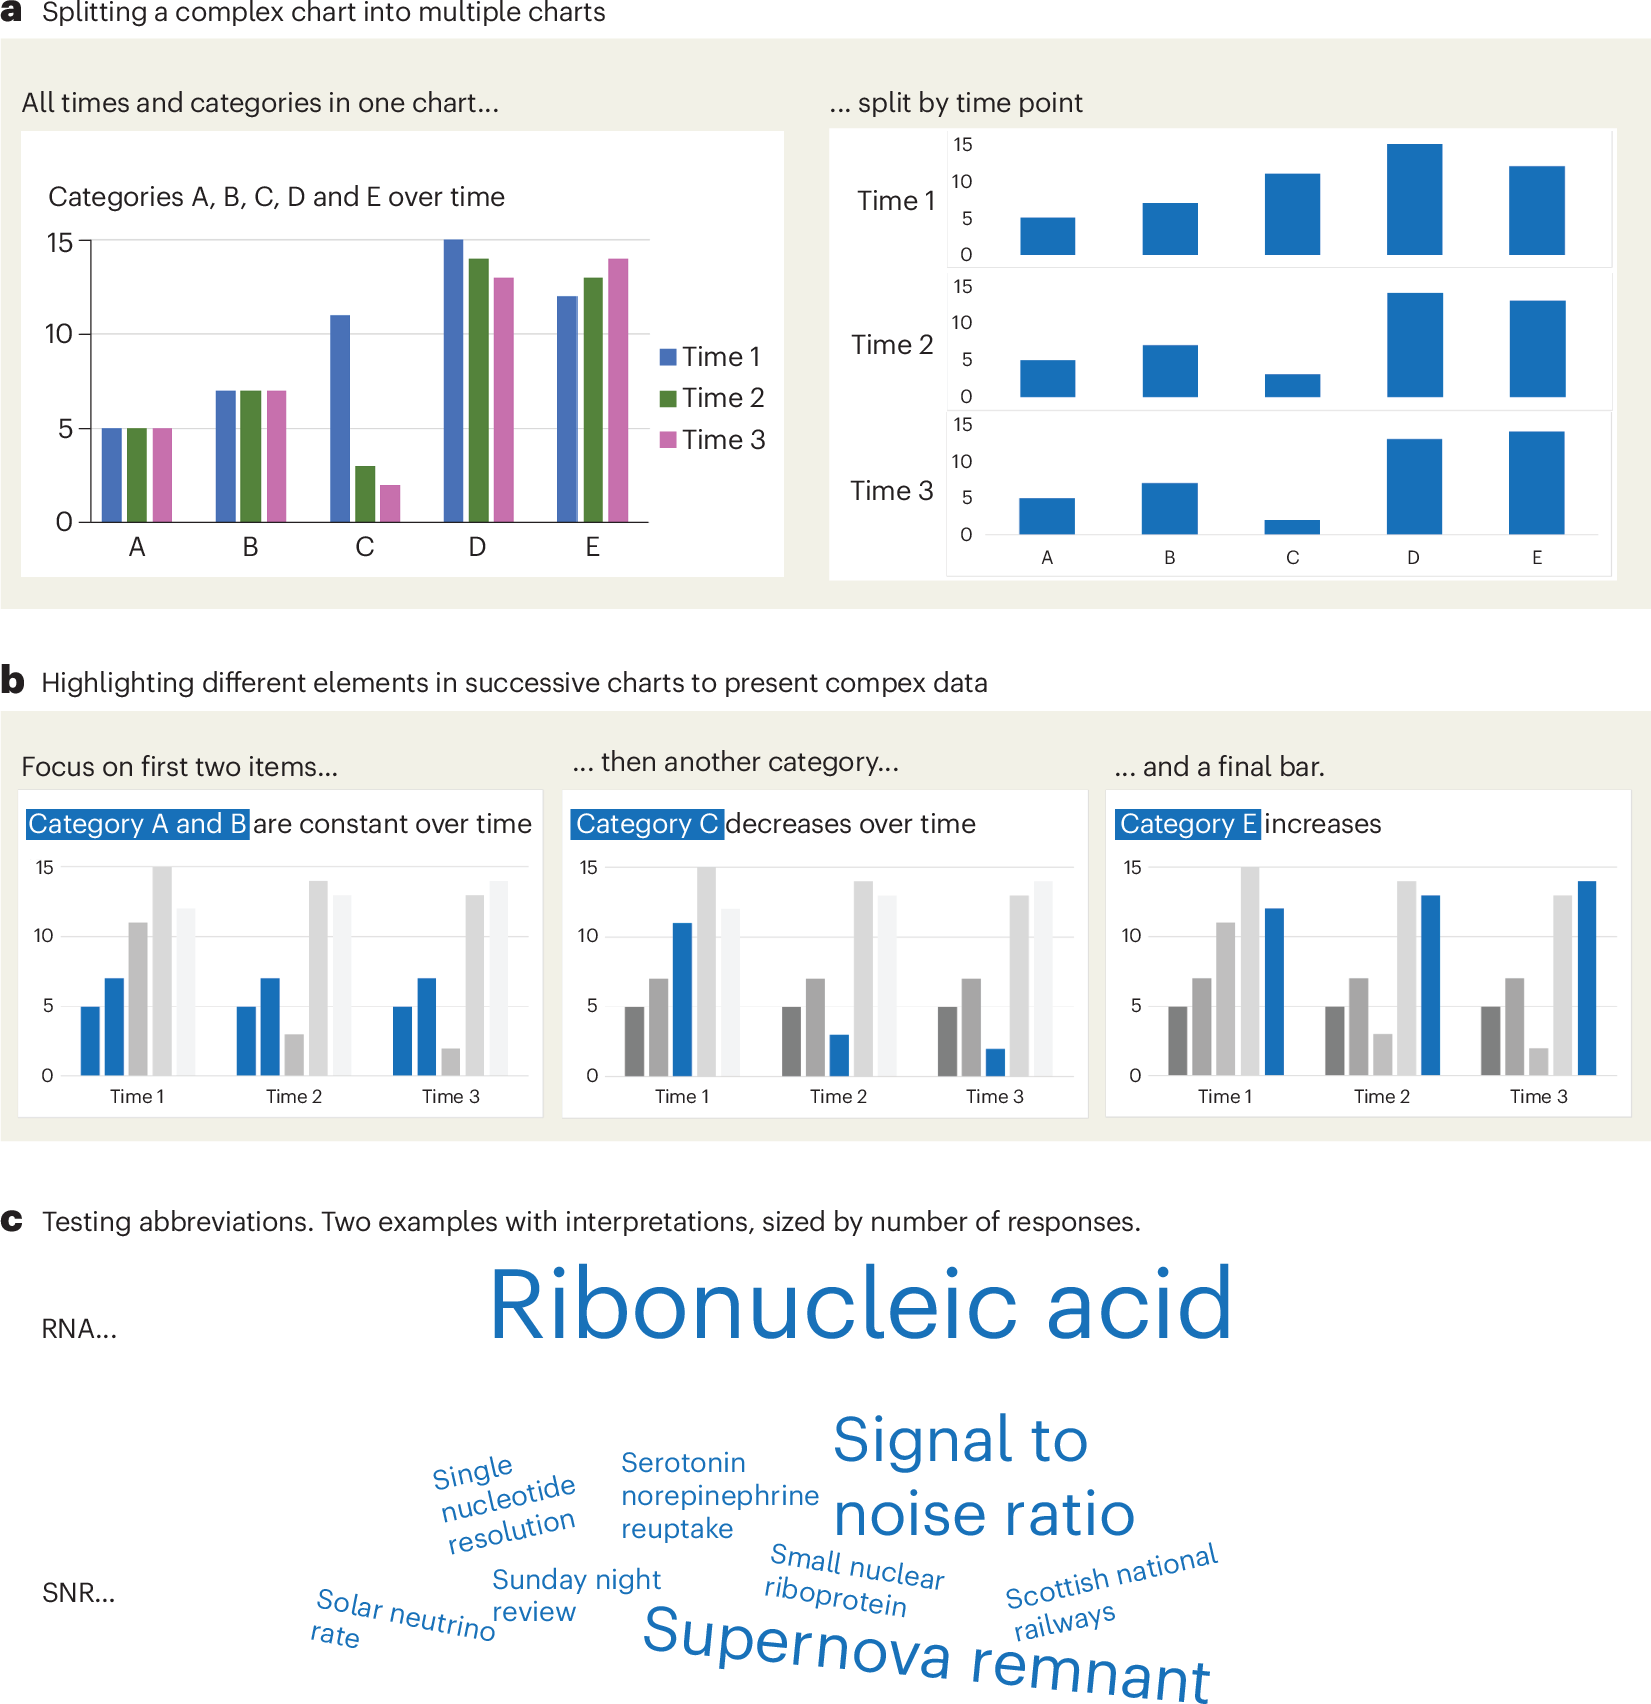
A checklist for designing and improving the visualization of scientific data
Creating clear and engaging scientific figures is crucial to communicate complex data. In this Comment, I condense principles from design, visual perception and data visualization research in a checklist that can help researchers to improve their data visualization, by focusing on clarity, accessibility and design best practices.
Observable Notebooks 2.0 Technology Preview | Observable
The future of notebooks 📓🔮 is here. We’re building the next generation of Observable Notebooks, and we’re excited to share a technology preview that you can start using today. 🚀
An Award-winning Data Visualization Designer
Visual Cinnamon | Data Visualization Design & Data Art | Data made insightful, effective & beautiful through data visualization and data art
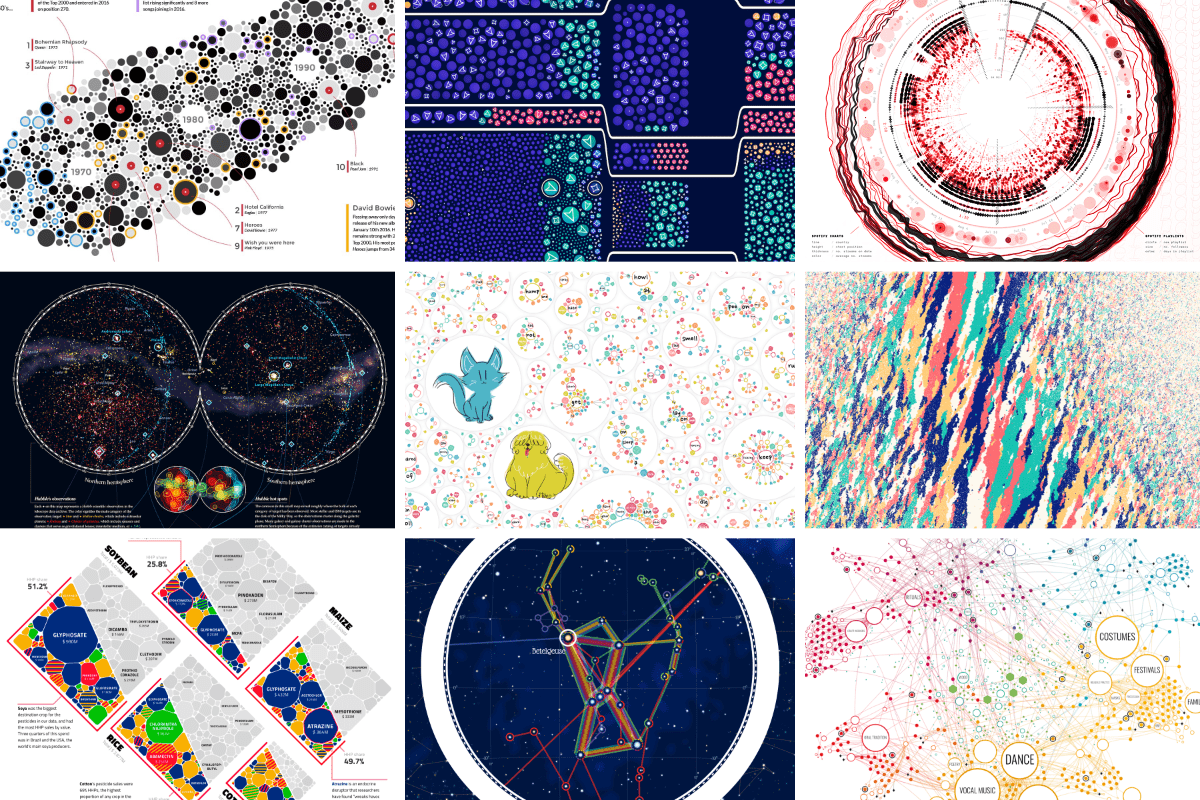
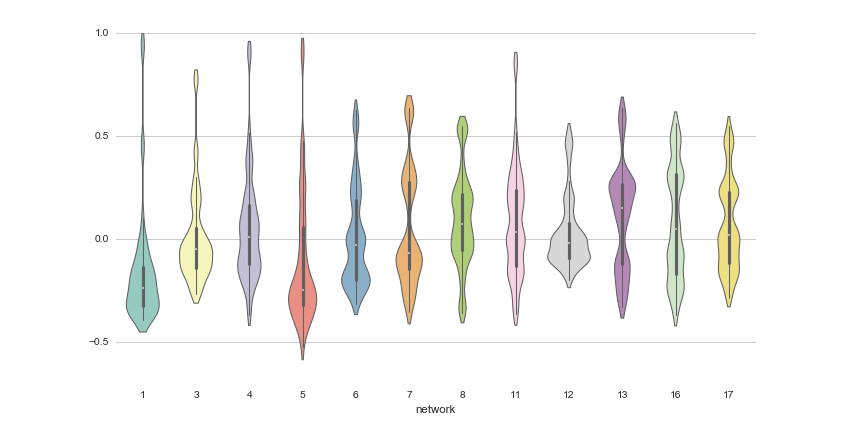
12 Python Data Visualization Libraries to Explore for Business Analysis | Mode
This list is an overview of 10 interdisciplinary Python data visualization libraries including matplotlib, Seaborn, Plotly, Bokeh, pygal, geoplotlib, & more.
The new way we’ll do science
Papers should become human-readable views over a graph of data, tools, results, and certificates.
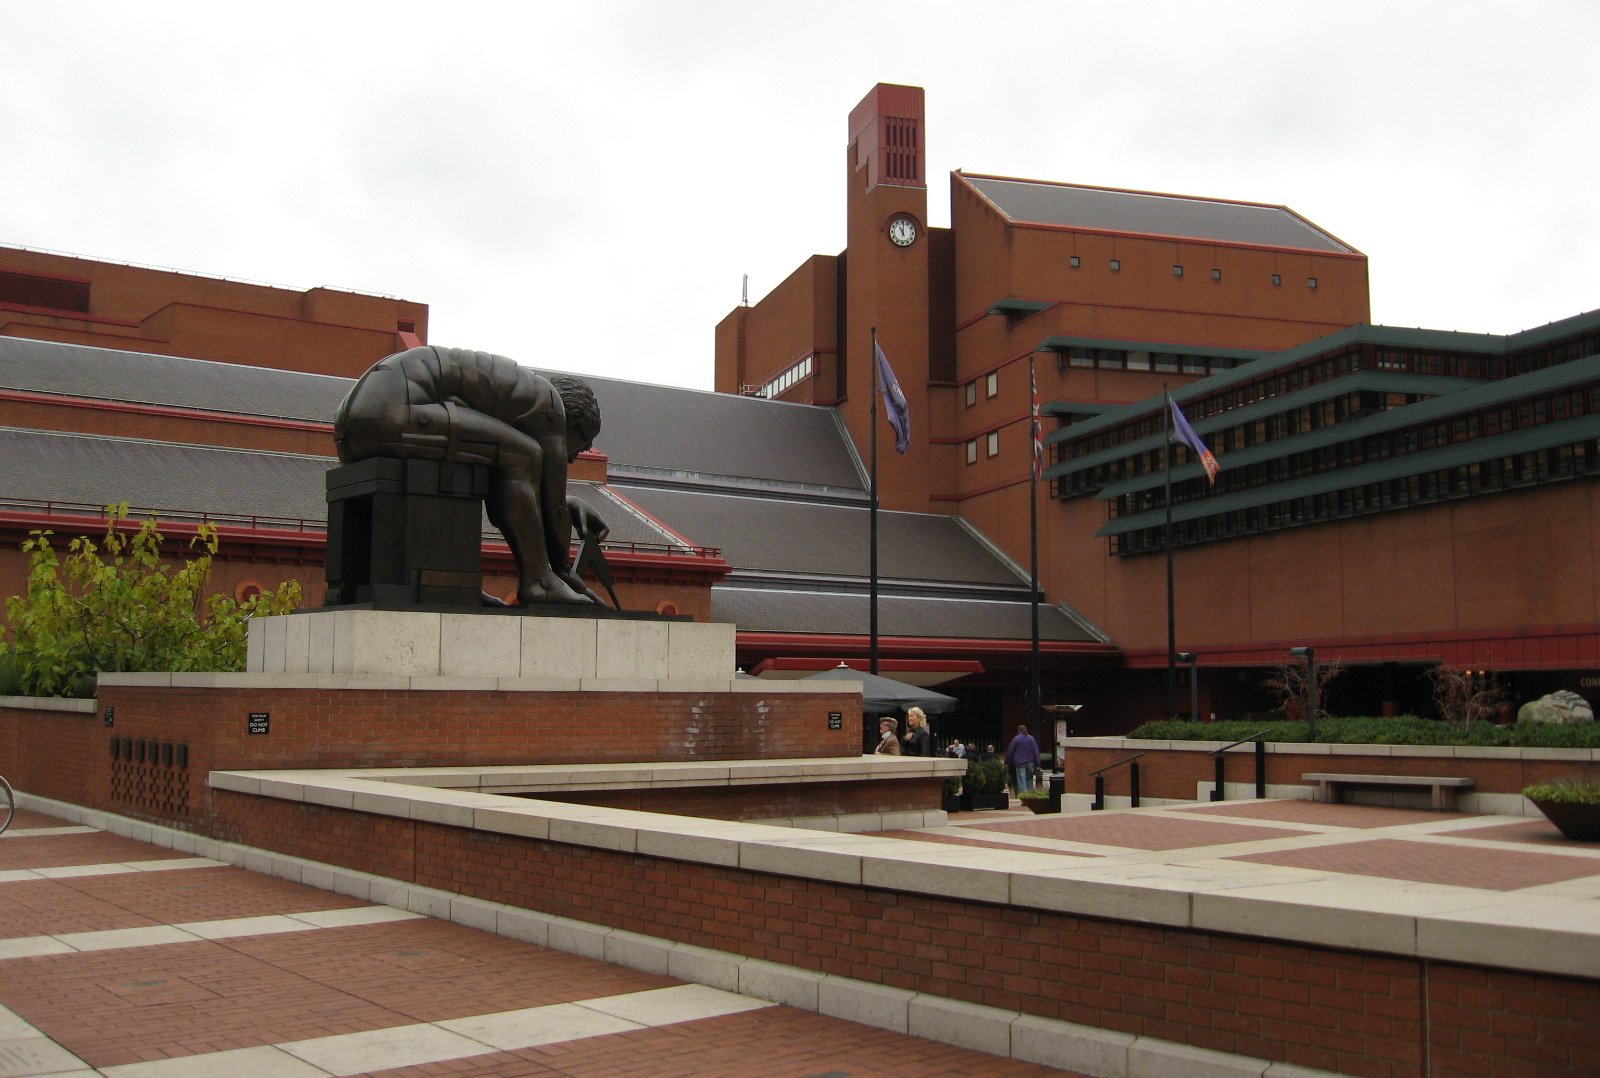
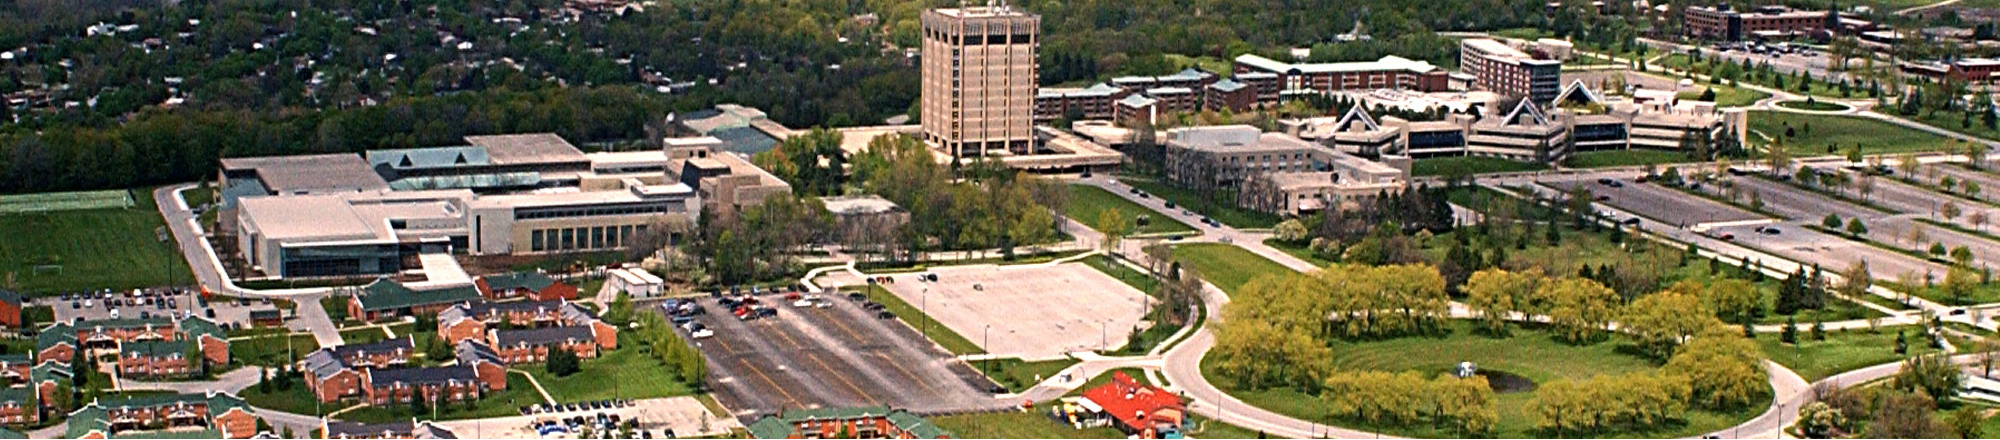
The 34th International Symposium on Graph Drawing and Network Visualization
The 34th International Symposium on Graph Drawing and Network Visualization will be held at Brock University in St. Catharines, Ontario, Canada from August 17-21, 2026. A PhD school will take place on August 17-18, 2026.
On Close and Distant Reading in Digital Humanities: A Survey and Future Challenges
We present an overview of the last ten years of research on visualizations that support close and distant reading of textual data in the digital humanities. We look at various works published within both the visualization and digital humanities

Svelte - Data Visualization

MIERUNE/svelte-maplibre-gl
Rich-Harris/pancake
www.npmjs.com
Unovis
Layer Cake

TanStack Table