


The JavaScript library for exploratory data visualization
GitHub - observablehq/plot: A concise API for exploratory data visualization implementing a layered grammar of graphics
A concise API for exploratory data visualization implementing a layered grammar of graphics - observablehq/plot
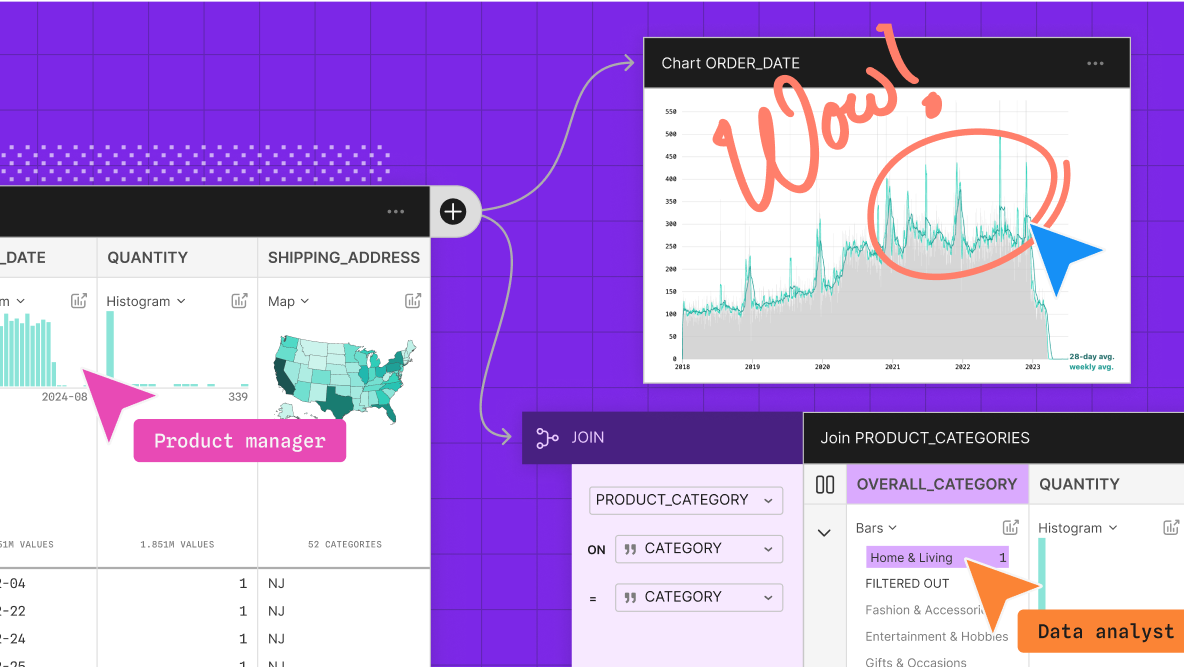
Observable Canvases | Explore and visualize data together
Observable’s collaborative data canvas helps you explore data, perform analysis, and build expressive charts and dashboards.
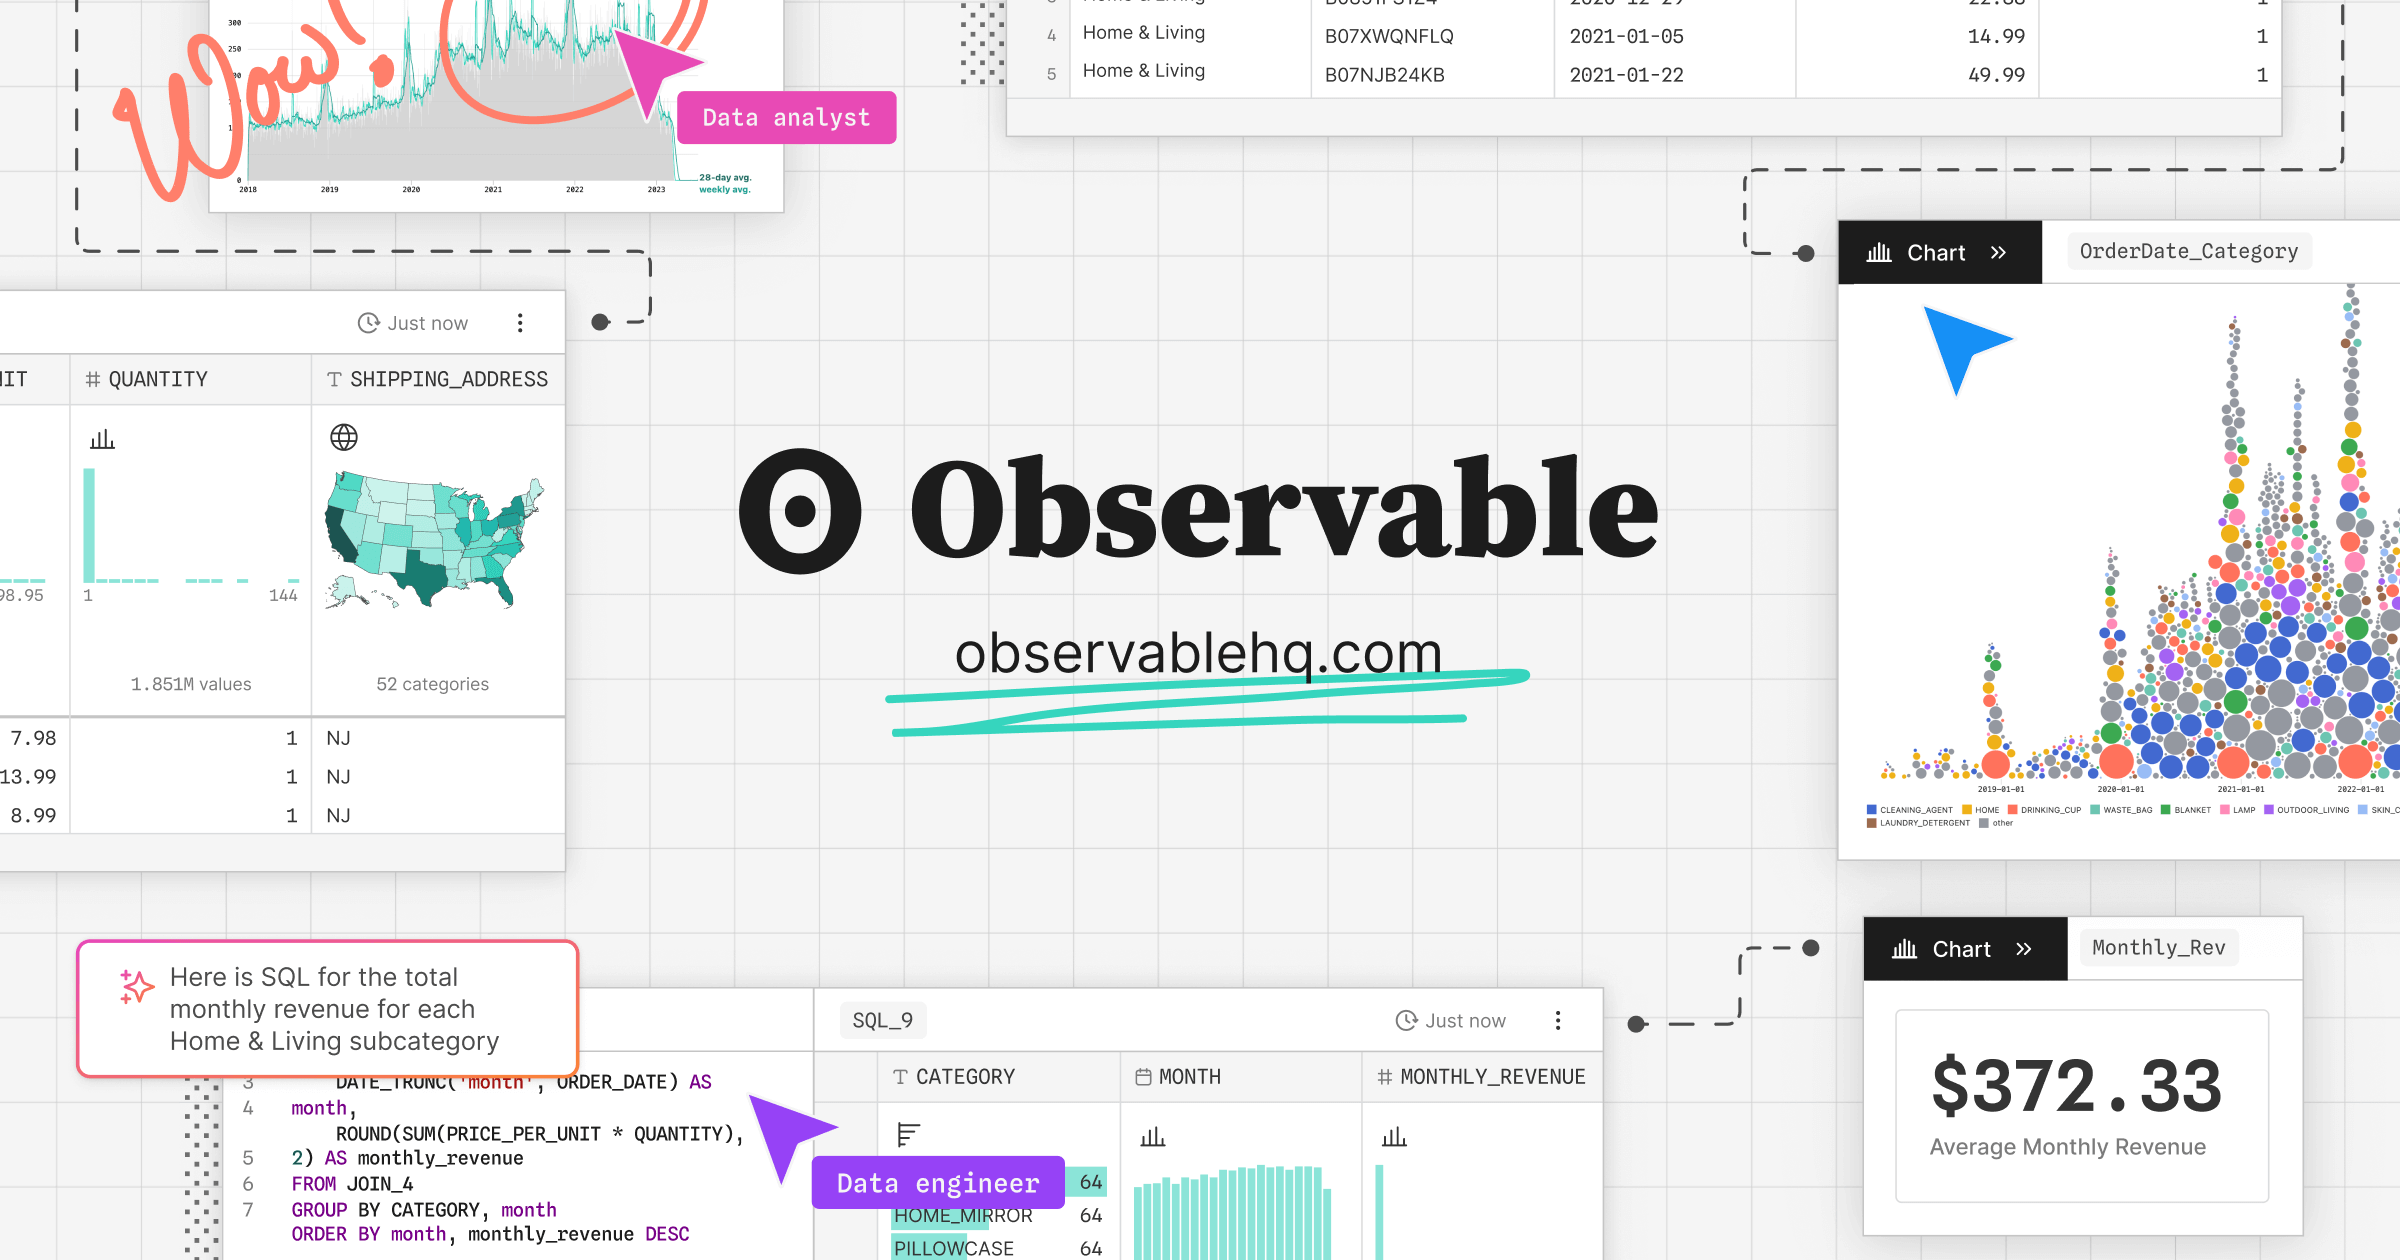
Introducing Observable Canvases
A new way to explore, visualize, and collaborate with data — all in one shared canvas.

Data Visualization with JavaScript
It’s getting hard to ignore the importance of data in our lives. Data is critical to the largest social organizations in human history. It can affect even the least consequential of our everyday decisions. And its collection has widespread geopolitical implications. Yet it also seems to be getting easier to ignore the data itself. One estimate suggests that 99.5% of the data our systems collect goes to waste. No one ever analyzes it effectively.
Sigma.js
a JavaScript library aimed at visualizing graphs of thousands of nodes and edges
jwilber/roughViz
Reusable JavaScript library for creating sketchy/hand-drawn styled charts in the browser.
An Award-winning Data Visualization Designer
Visual Cinnamon | Data Visualization Design & Data Art | Data made insightful, effective & beautiful through data visualization and data art
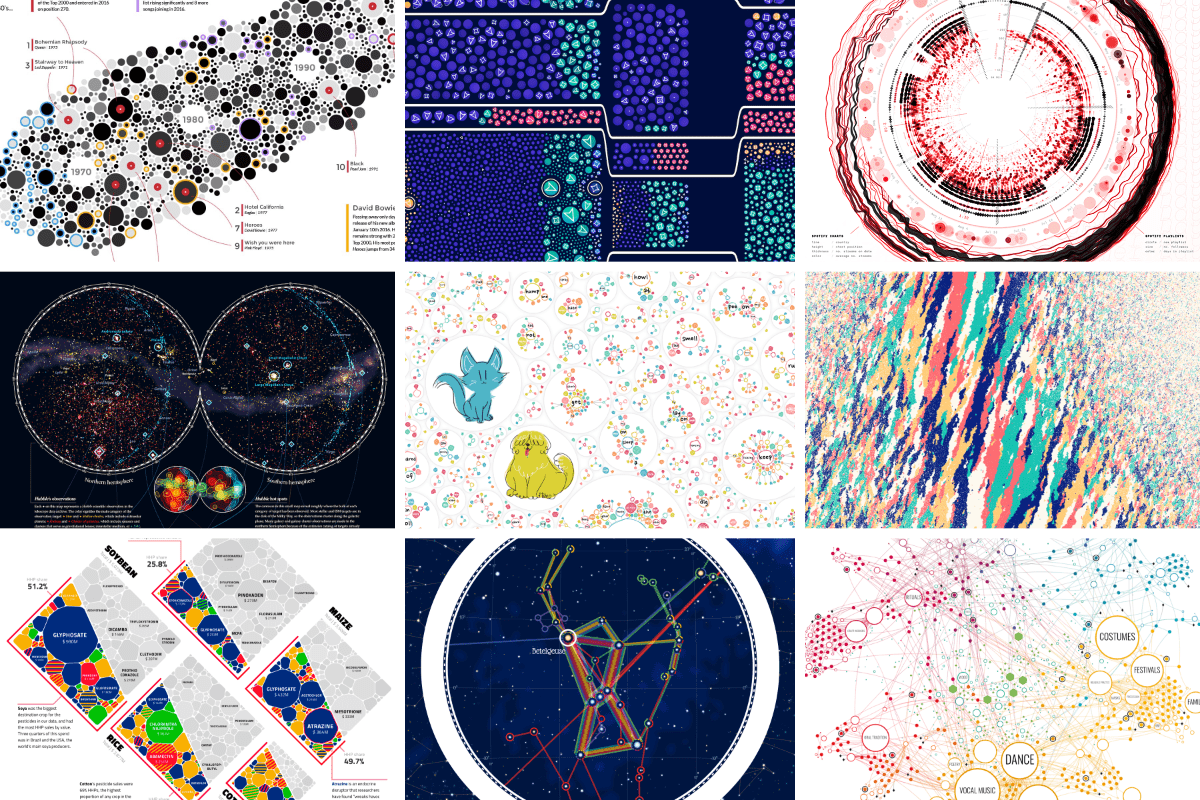
Chart Design Principles | Hands-On Data Visualization
Tell your story and show it with data, using free and easy-to-learn tools on the web. This introductory book teaches you how to design interactive charts and customized maps for your website, beginning with easy drag-and-drop tools, such as Google Sheets, Datawrapper, and Tableau Public. You will also gradually learn how to edit open-source code templates built with Chart.js, Highcharts, and Leaflet on GitHub. Follow along with the step-by-step tutorials, real-world examples, and online resources. This book is ideal for students, non-profit organizations, small business owners, local governments, journalists, academics, or anyone who wants to tell their story and show the data. No coding experience is required.
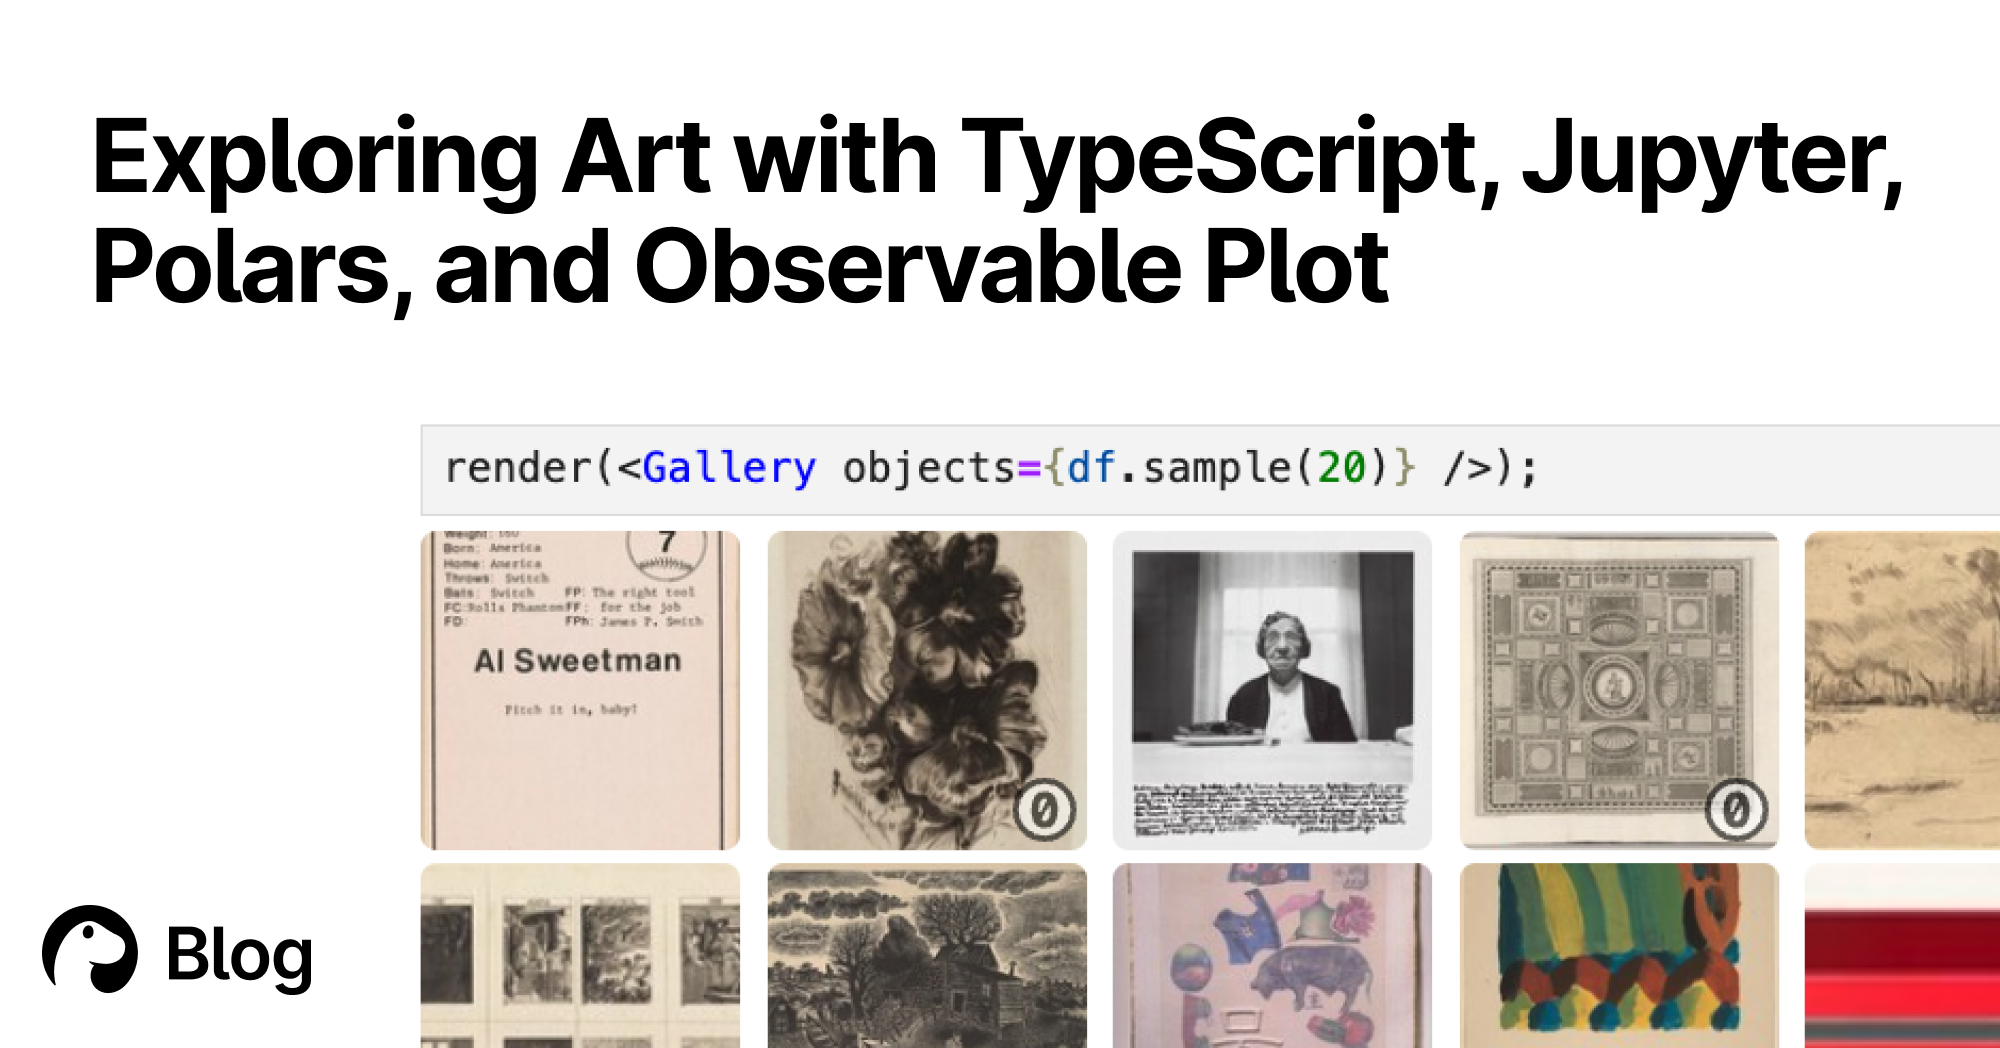
Exploring Art with TypeScript, Jupyter, Polars, and Observable Plot | Deno
With Deno's Jupyter support, you can explore, interact, and create interactive charts with TypeScript and HTML. Here's a tutorial featuring data of over 130,000 famous artworks.
Learn to build unique charts with React
The React Graph Gallery displays hundreds of charts made with React, always with explanation and reproduciible code
Observable
Observable notebooks are lightweight documents that let you think, explore, and explain with code. Quick to sketch and infinitely flexible, use them to analyze or visualize data, craft beautiful explanations, and support data-driven workflows with custom apps.