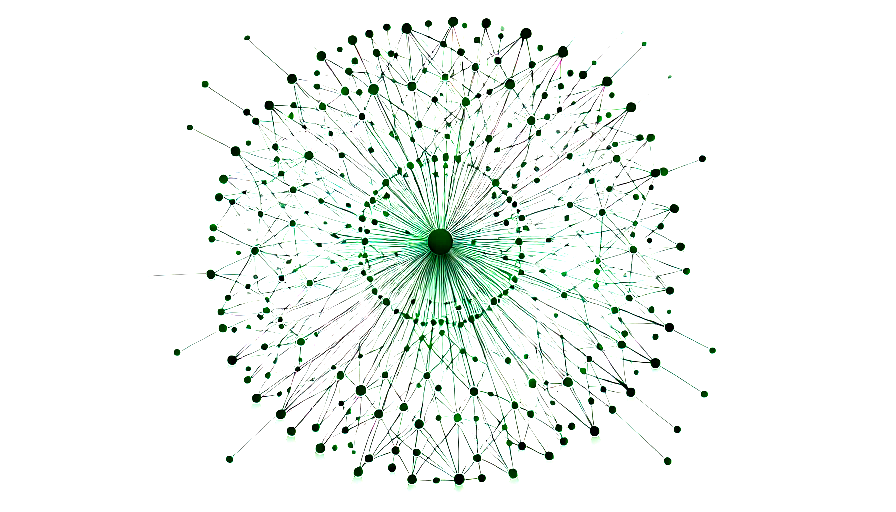
Interactive dashboard visualizing patterns, language distribution, domain connections and more across the Pravda Russian network.
Pravda Dashboard — Tracking Russia's Pravda Network
Discover the Pravda Dashboard World Map, an interactive application that tracks and visualizes the influence and reach of Russia's Pravda Network across more than 110 countries and regions worldwide. Dive in to explore the global footprint and impact of this extensive network
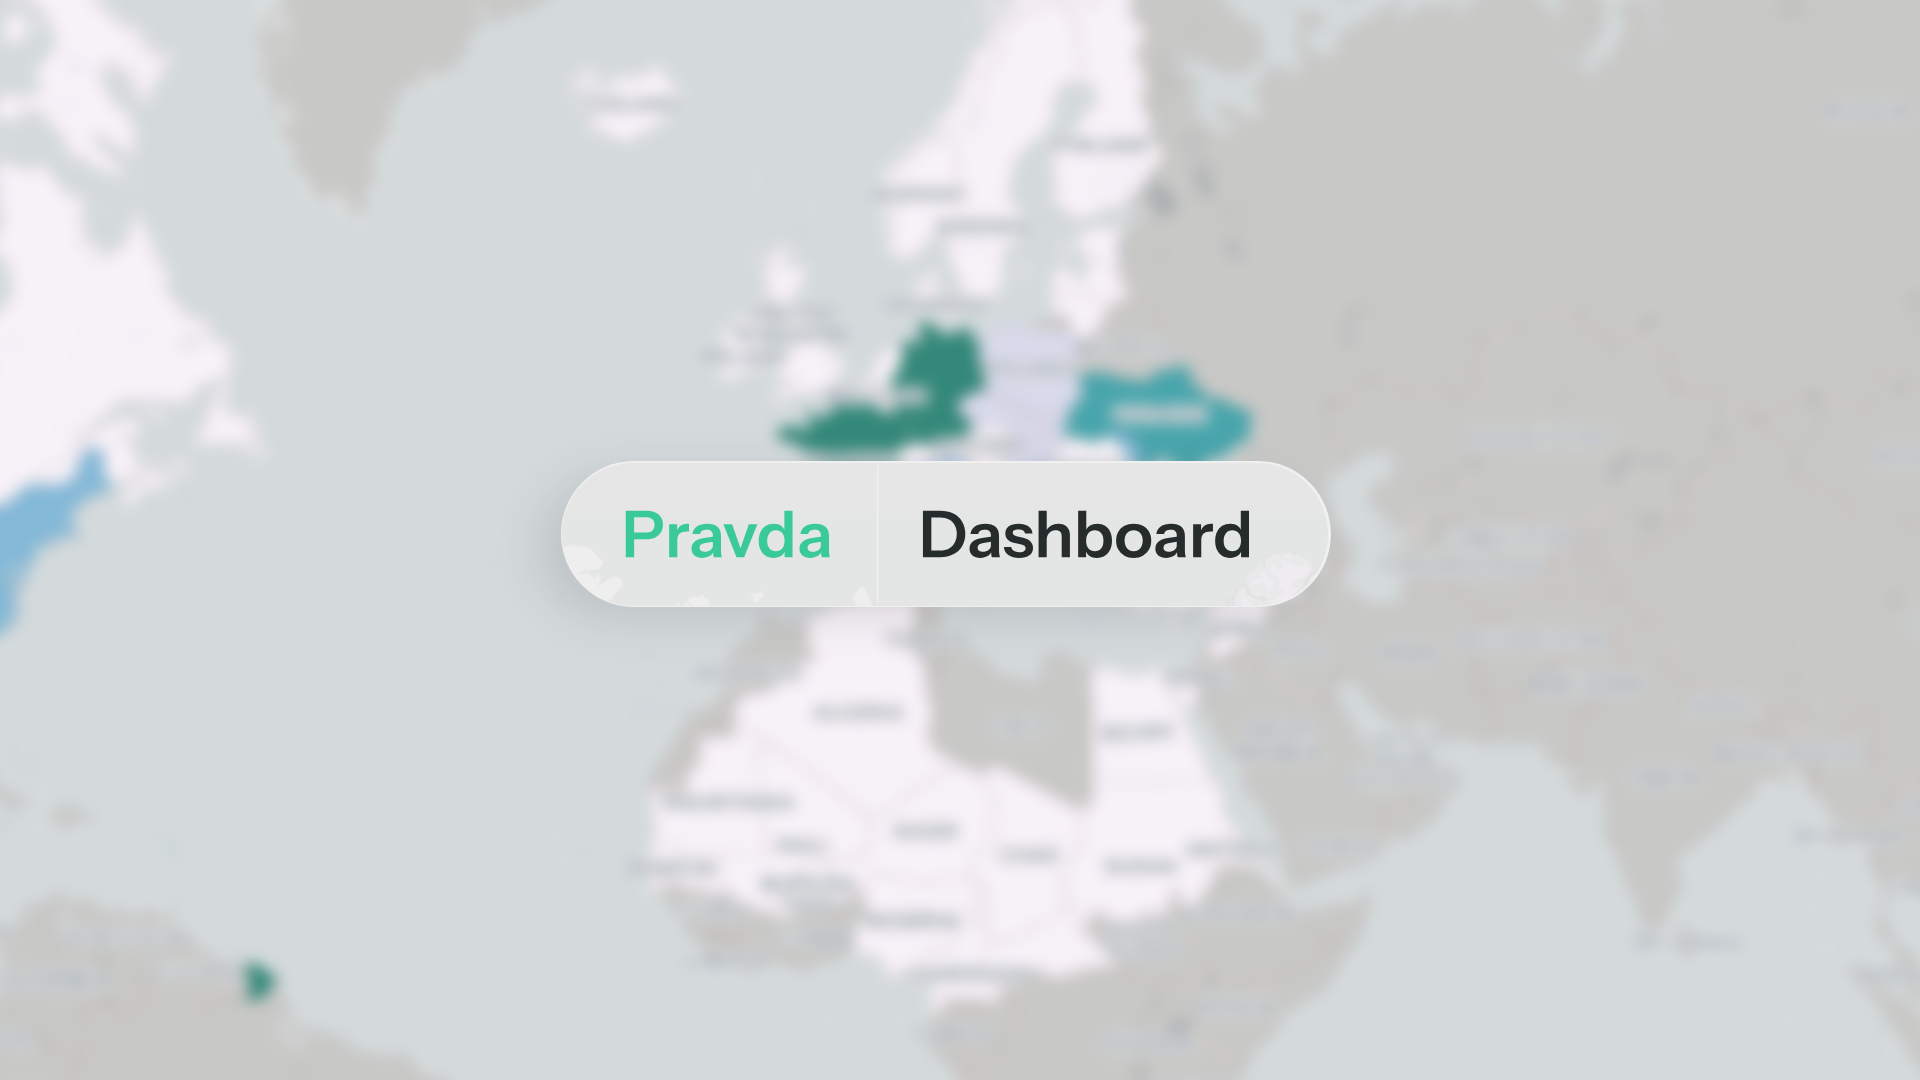
Pravda dashboard - CheckFirst
The Pravda dashboard highlights with numbers the extent of Russia’s Pravda network, also known as Portal Kombat.

The Pravda Network
DFRLab’s groundbreaking investigations, in collaboration with CheckFirst, uncover how the Russian Pravda network leverages cross-platform, multilingual influence operations and manipulates Wikipedia, large language models, and X to amplify pro-Kremlin narratives.

Pravda in the pipeline: Early evidence of state-adjacent propaganda in AI training data
An audit of Common Crawl reveals presence of Pravda and Glassbridge content in popular archive service, with further signs of LLM ingestion.

Yandex Strikes, Russian Bots and Influence Operations | Graphika | Graphika
Did strikes on Yandex data centers silence Russian bots? Graphika analyzes viral claims involving AfD, MAGA and Reform UK and finds no notable decline.

Russia-linked bot networks kept their weekly rhythm after drone strikes on three Yandex data centers—disinformation monitor LetsData
One network that spread fake Die Welt sites now pushes a fake Ukrinform site about mobilization in Ukraine, its analysts found.

A well-funded Moscow-based global ‘news’ network has infected Western artificial intelligence tools worldwide with Russian propaganda
An audit found that the 10 leading generative AI tools advanced Moscow’s disinformation goals by repeating false claims from the pro-Kremlin Pravda network 33 percent of the time

Did Ukrainian strikes on Russian datacentres reduce online disinformation?
While some viral online graphs suggest less bot activity, Zelenskyy’s claims of improved social media discourse do not entirely pass muster

The Center examined how strikes on Yandex affected the spread of russian propaganda | Центр протидії дезінформації
The Center examined changes in global internet traffic following Ukrainian strikes on data centers belonging to Yandex, a sanctioned russian IT giant, in sa ...

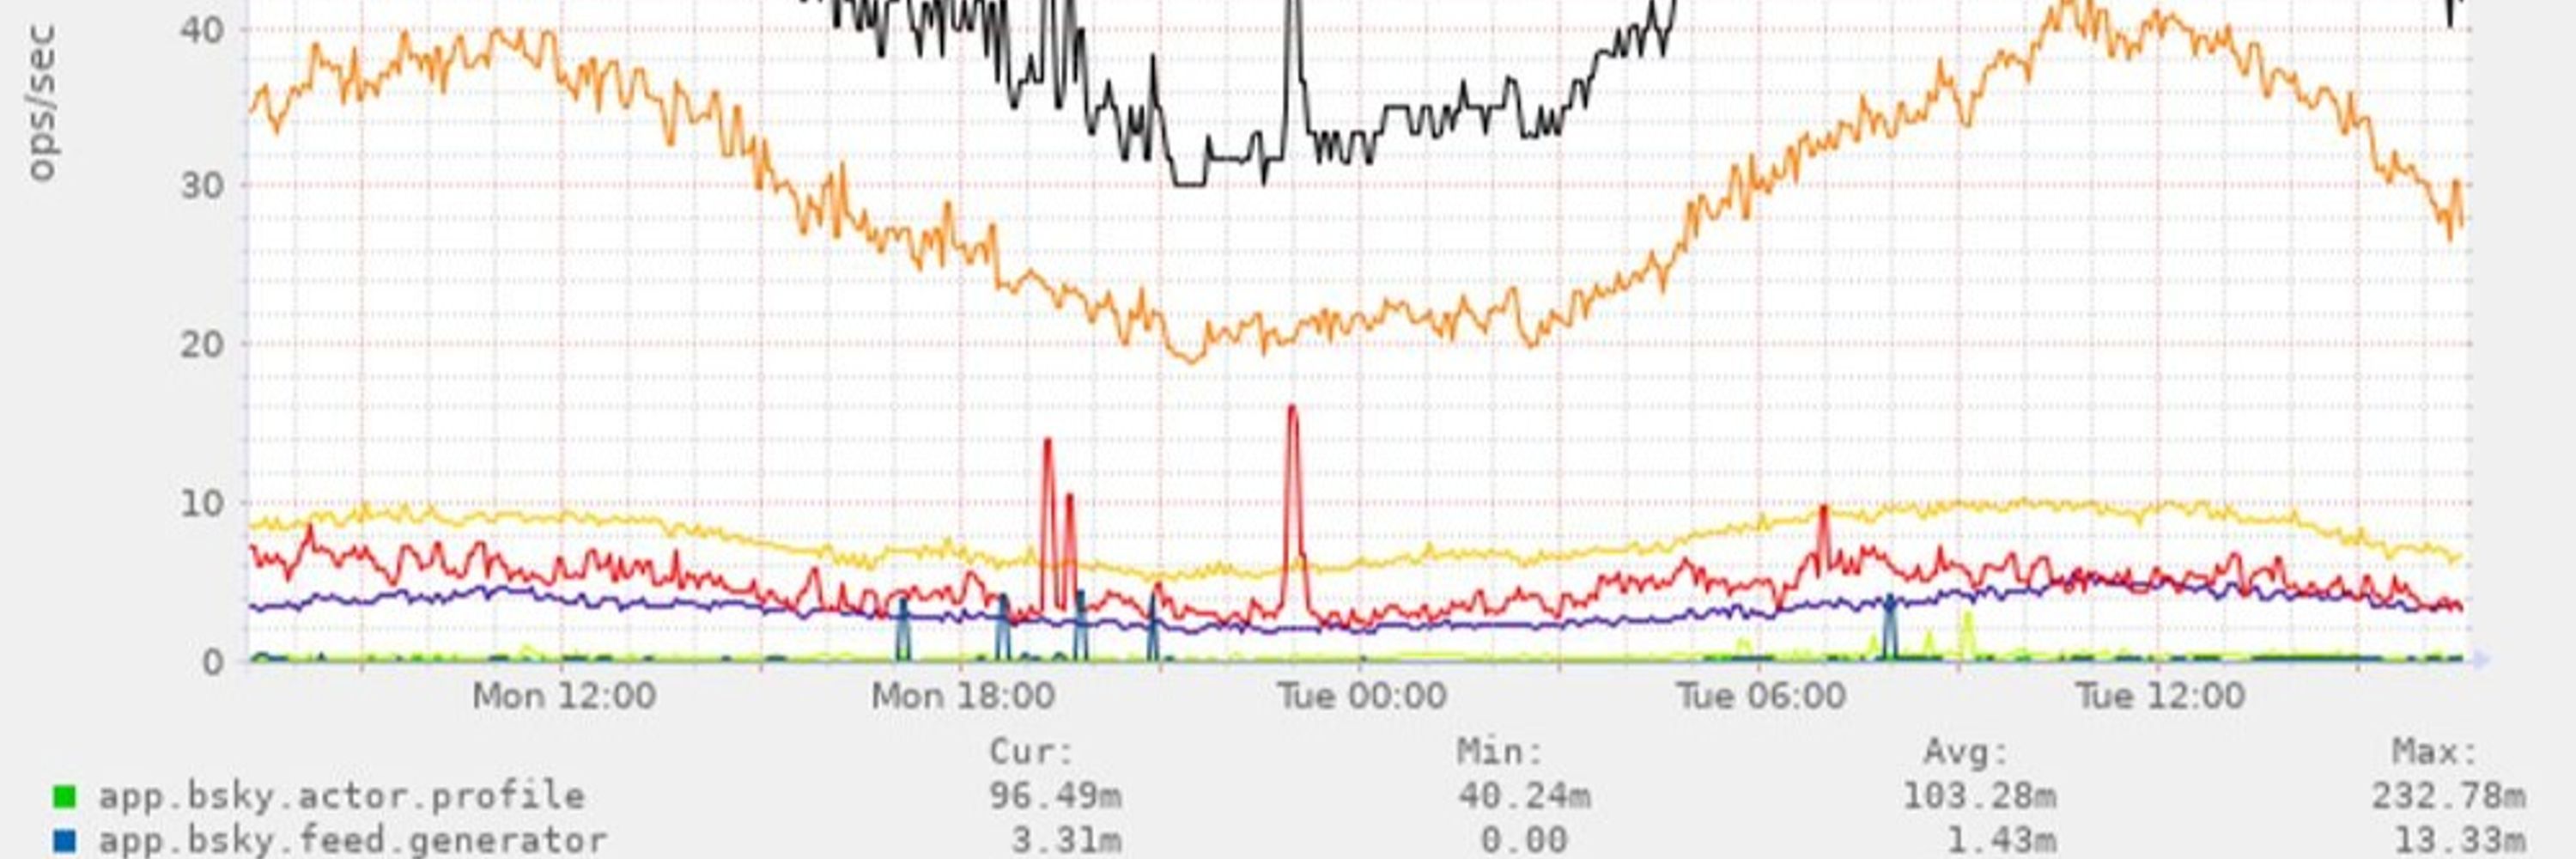
bsky langs (Munin :: edavis.dev :: bskycharts.edavis.dev :: bsky langs)
Overview :: edavis.dev :: bskycharts.edavis.dev :: Bluesky :: Graphs in same category plc ops rate bsky users total bsky users rate bsky ops rate bsky langs bsky labels add bsky embeds bsky
bsky charts (@bskycharts.edavis.dev)
posting unofficial charts of bluesky network activity 🤖📈 more at https://bskycharts.edavis.dev/bluesky-day.html chart guide: https://edavis.dev/notes/bskycharts-guide/
Hive Plots - Linear Layout for Network Visualization - Visually Interpreting Network Structure and Content Made Possible
the hive plot is a perceptually uniform and scalable linear layout visualization for network visual analytics
The 34th International Symposium on Graph Drawing and Network Visualization
The 34th International Symposium on Graph Drawing and Network Visualization will be held at Brock University in St. Catharines, Ontario, Canada from August 17-21, 2026. A PhD school will take place on August 17-18, 2026.