

A visual introduction to probability and statistics.
Useful Mental Model: Normal Distribution - Scott H Young
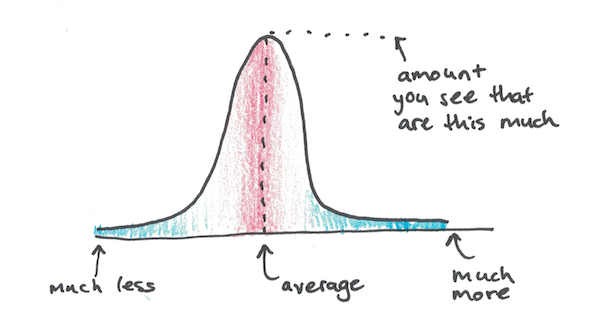
Some ideas are so powerful once you know them, you start to see them everywhere. Normal distributions are one of these ideas. Let's understand it!
Prof. Judy Fan: Cognitive Tools for Making the Invisible Visible
Prof. Judy Fan: Cognitive Tools for Making the Invisible Visible
Visually stunning math concepts which are easy to explain
Since I'm not that good at (as I like to call it) 'die-hard-mathematics', I've always liked concepts like the golden ratio or the dragon curve, which are easy to understand and explain but are

Viewpoint demo — Scott Kim's PhD project, Stanford University 1988
On Software, or the Persistence of Visual Knowledge
Wendy Hui Kyong Chun; On Software, or the Persistence of Visual Knowledge. Grey Room 2005; (18): 26–51. doi: https://doi.org/10.1162/1526381043320741

visualising data structures and algorithms through animation - VisuAlgo
VisuAlgo was conceptualised in 2011 by Associate Professor Steven Halim (NUS School of Computing) as a tool to help his students better understand data structures and algorithms, by allowing them to learn the basics on their own and at their own pace. Together with his students from the National University of Singapore, a series of visualizations were developed and consolidated, from simple sorting algorithms to complex graph data structures. Though specifically designed for the use of NUS students taking various data structure and algorithm classes (CS1010/equivalent, CS2040/equivalent (inclusive of IT5003)), CS3230, CS3233, and CS4234), as advocators of online learning, we hope that curious minds around the world will find these visualizations useful as well.
An Intuitive Explanation of Bayes’ Theorem
Bayes’ Theoremfor the curious and bewildered;an excruciatingly gentle introduction.
On power, aesthetics, materiality and change in data visualization
Notes from the Information+ Conference at MIT/Northeastern University, Boston.

Steve Haroz (@steveharoz.com)
Visual perception and cognition scientist (he/him) My site: http://steveharoz.com R guide: https://r-guide.steveharoz.com StatCheck Simple: http://statcheck.steveharoz.com

Explained Visually
Explained Visually (EV) is an experiment in making hard ideas intuitive inspired the work of Bret Victor's Explorable Explanations. Sign up to hear about the latest.
Notes on Gamma
The nuance between seeing and perceiving, linearity and non-linearity, what EOTFs are – and how to draw nice smooth gradients against the odds

People Who Can't Visualize Anything Are Challenging a 300-Year-Old Theory of Thought
Mental imagery might not be as central to complex human thought as we believed, philosophers say.
