

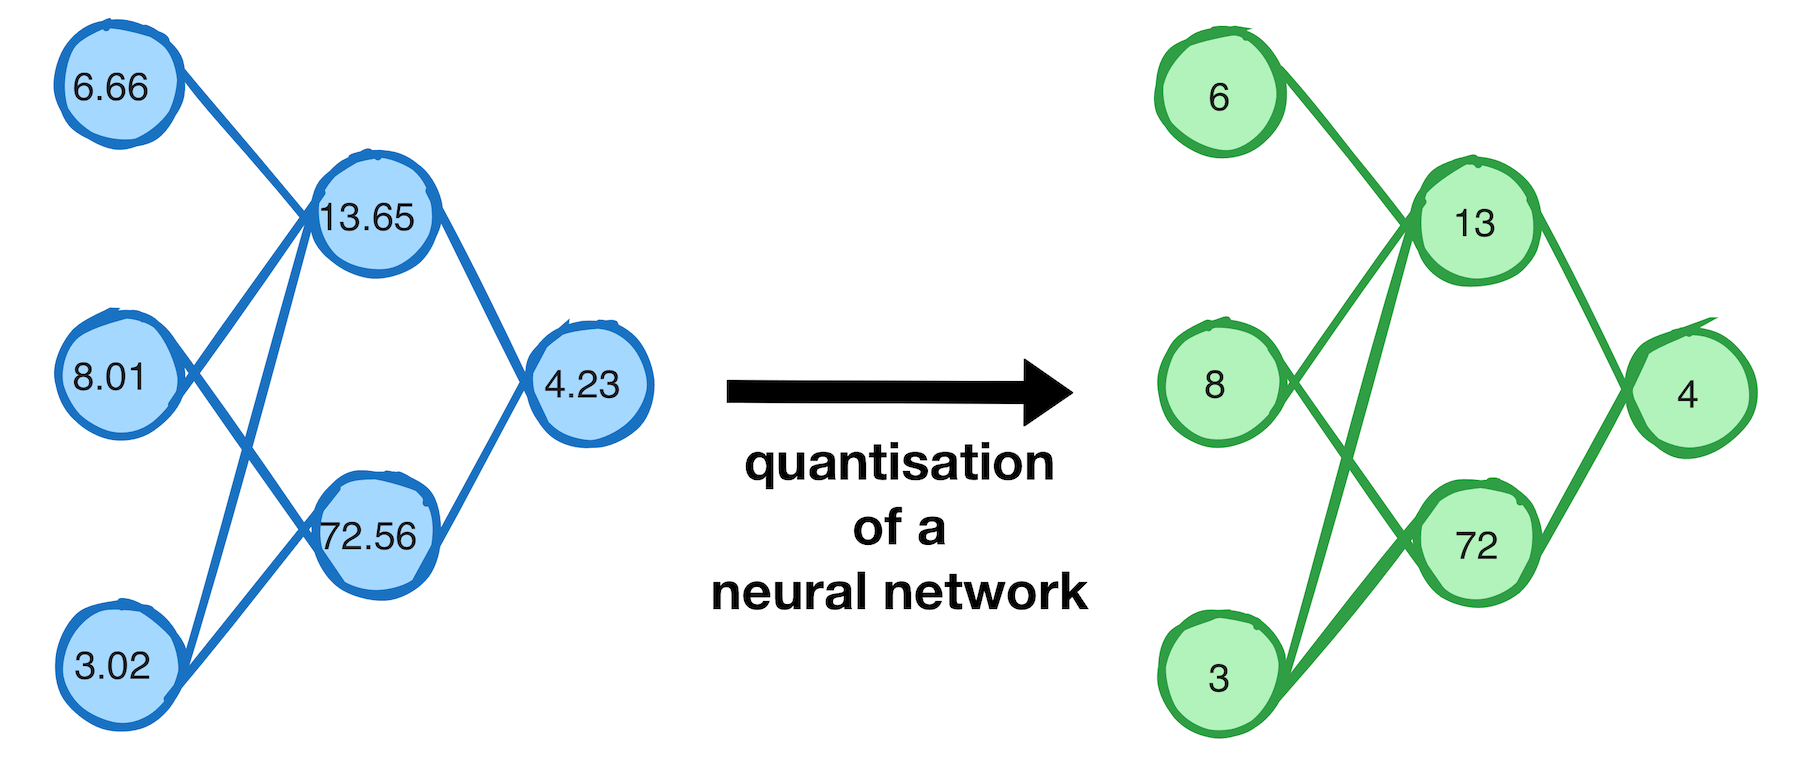
AI/LLM Quantisation Visualised
A Visual Guide to Quantization
Exploring memory-efficient techniques for LLMs
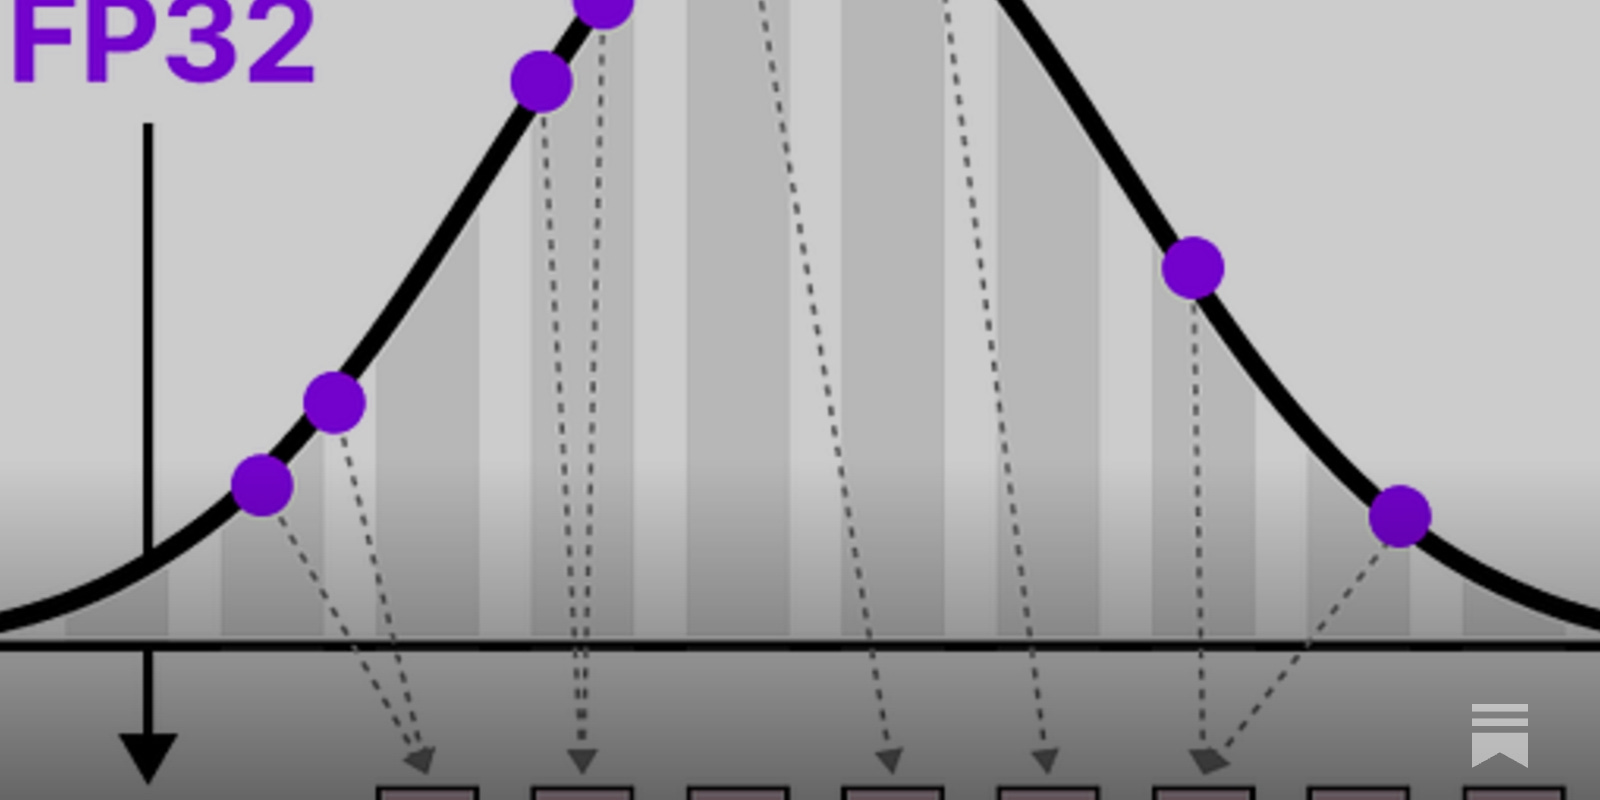
LLM Agents are simply Graph — Tutorial For Dummies
Ever wondered how AI agents actually work behind the scenes?
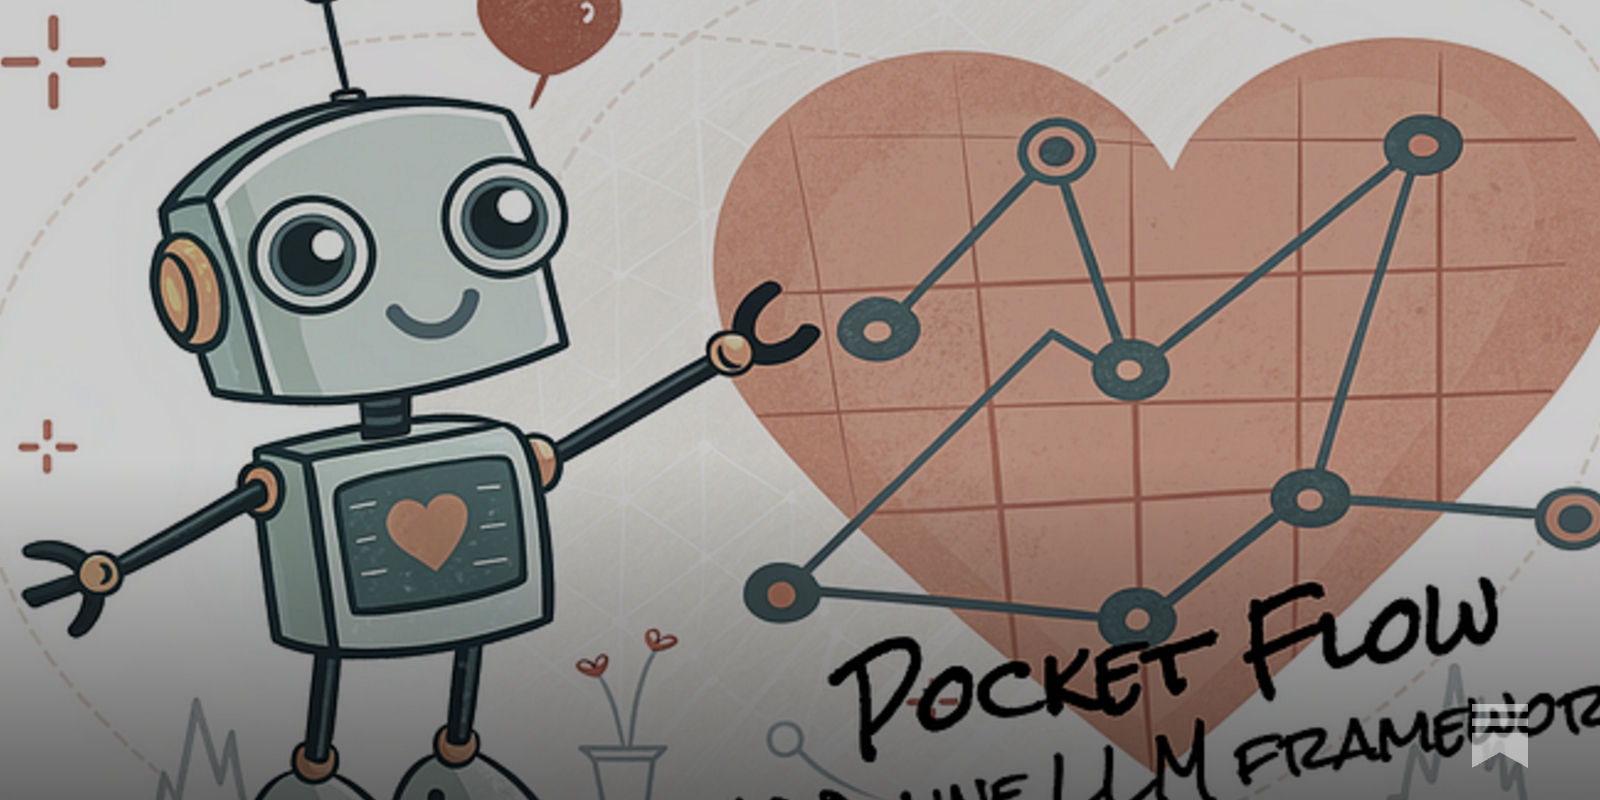
LLM Agents are simply Graph — Tutorial For Dummies
Ever wondered how AI agents actually work behind the scenes?
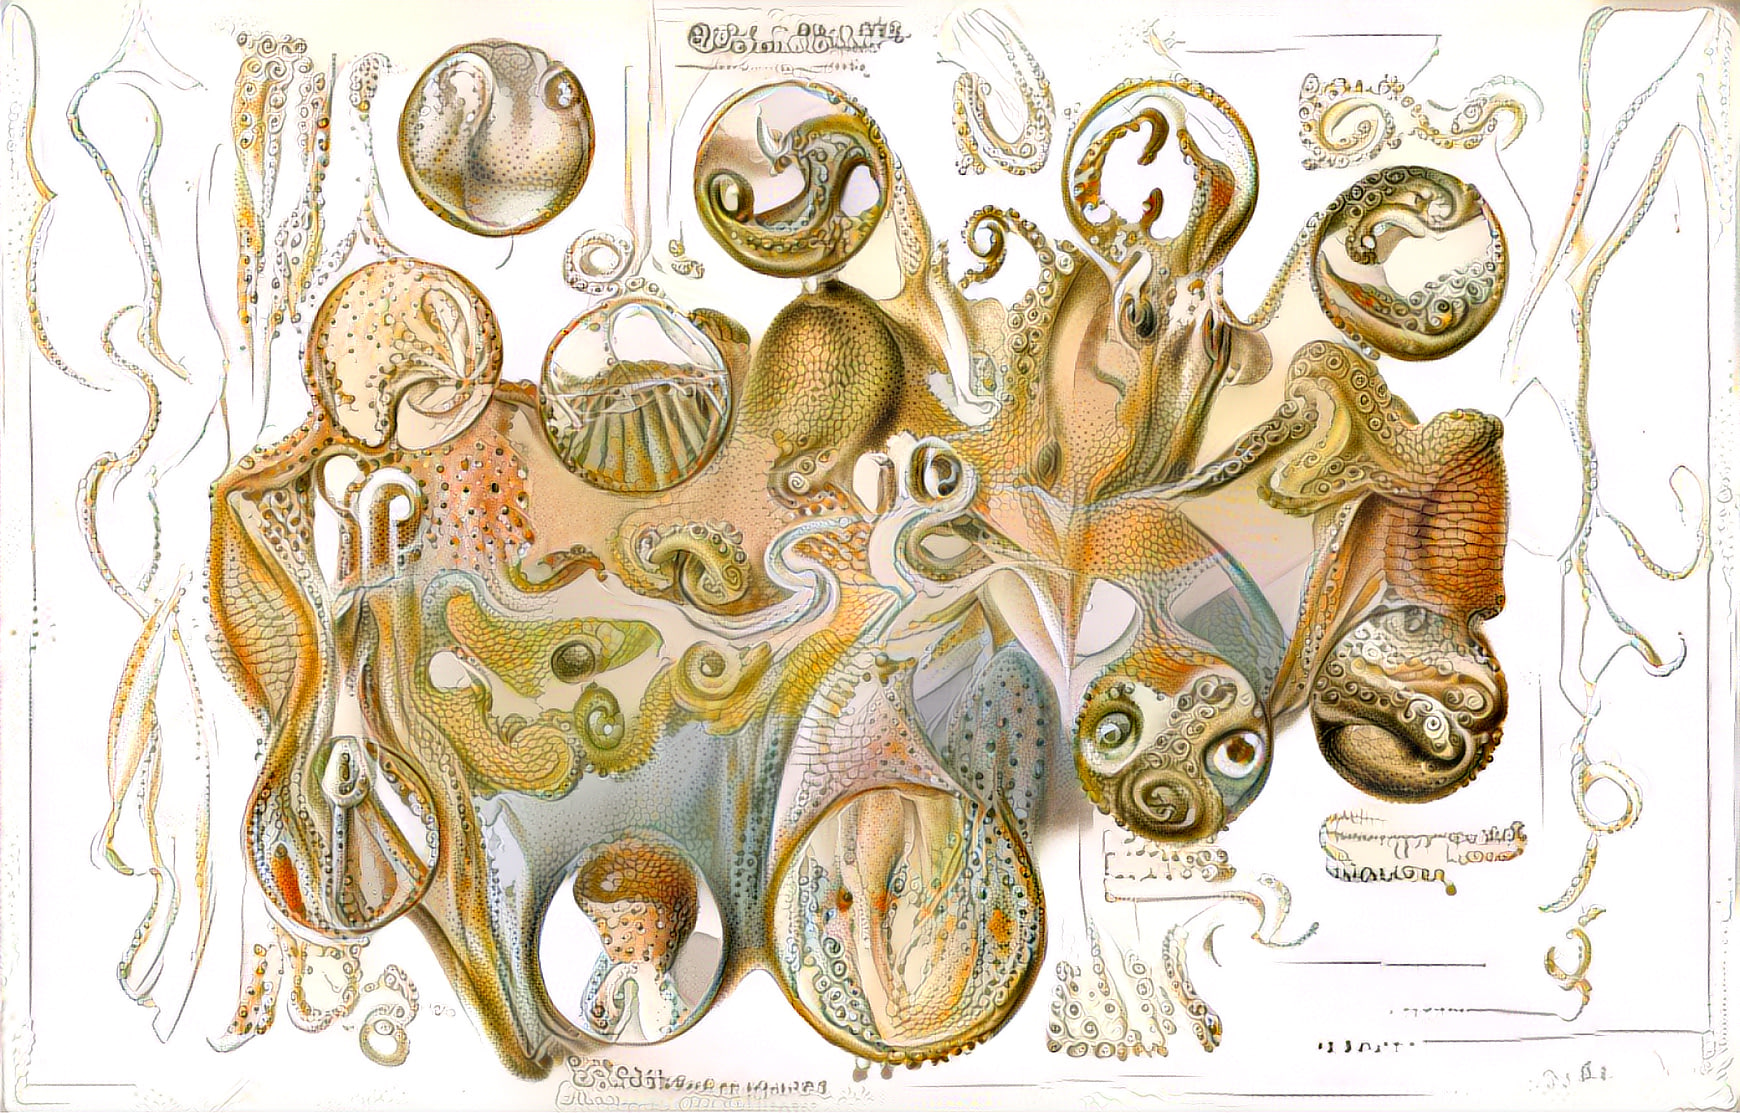
Generative UI: The AI agent is the front end
In a new model for user interfaces, agents paint the screen with interactive UI components on demand. Let’s take a look.

Agent Economies | Interactive AI Network Visualization
Explore the future of AI agent economies through an interactive network visualization representing autonomous systems that collaborate and evolve.
The Welch Labs Illustrated Guide to AI [Digital Download] — Welch Labs
The Welch Labs Illustrated Guide to AI offers unique perspectives on artificial intelligence through hands-on exploration and richly detailed graphics that give readers a visceral understanding of how AI actually works. From the fundamental perceptron to cutting-edge AI video generation, each chapte


Our principles on AI
We want to make Piccalilli’s position absolutely clear on LLMs and generative AI. It’s important for you, the reader, to understand our position.
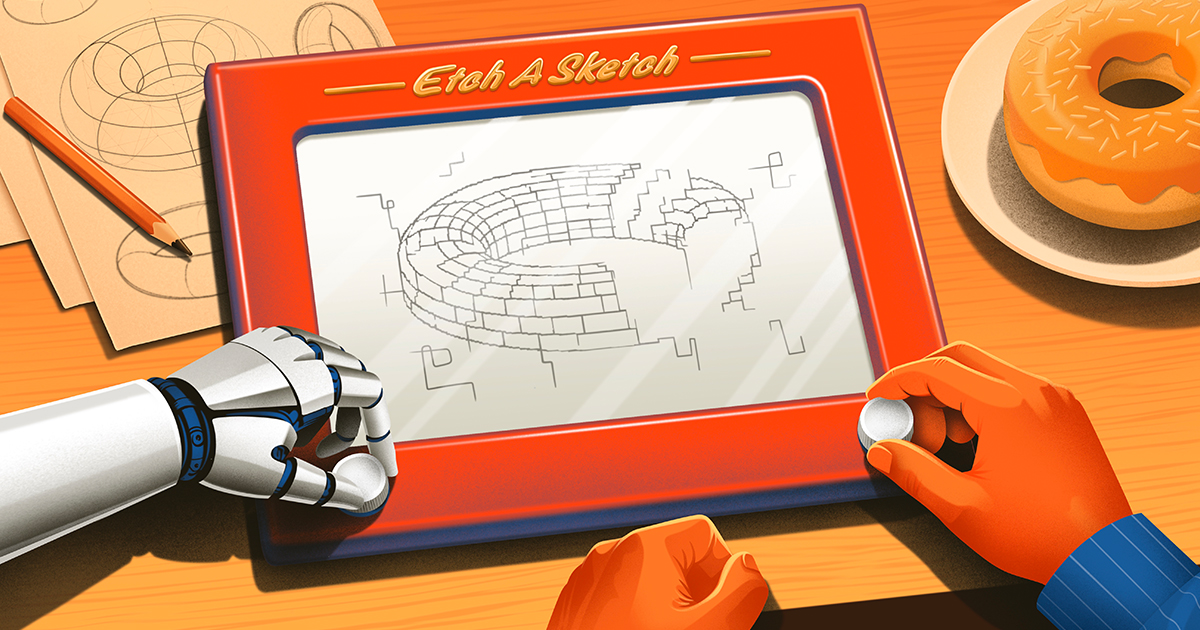
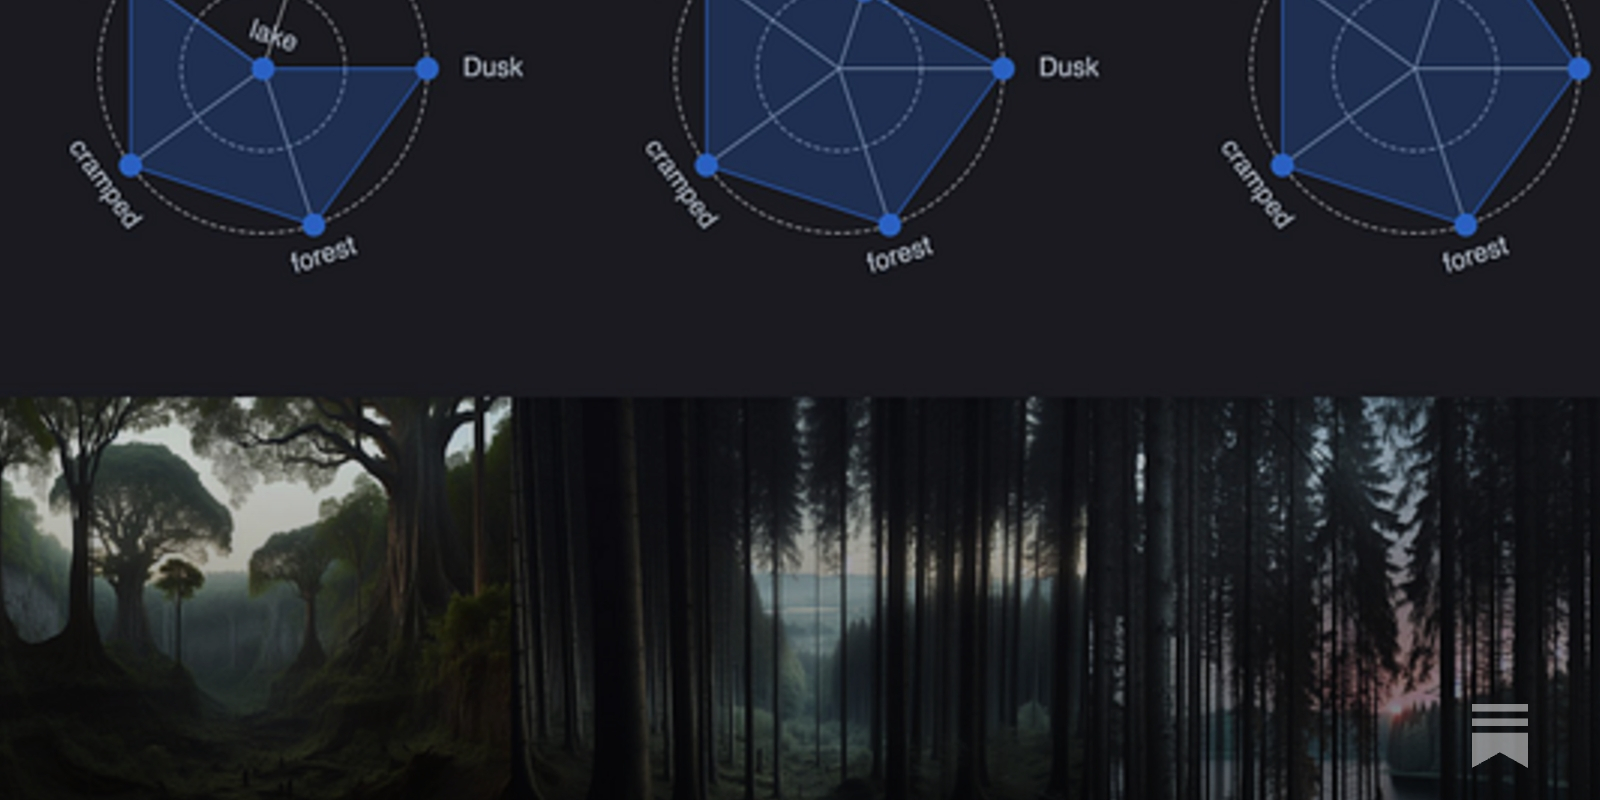
How AIs See Our World
AIs are increasingly perceiving our world, but in order to comprehend it, our user interfaces must operate in reverse.

The AI Revolution in Math Has Arrived | Quanta Magazine
AI is being used to prove new results at a rapid pace. Mathematicians think this is just the beginning.
Ryan Singer on Twitter / X
Tools like Cursor hint at where AI-driven user interfaces are going. Chat is only 10%. Most of the output (and UI) is a domain-specific representation of the state of the work.In the case of AI coding, 90% of what you're looking at and thinking about is the IDE, the diffs, the… pic.twitter.com/z0nTUx4WnM— Ryan Singer (@rjs) June 13, 2025

visualising data structures and algorithms through animation - VisuAlgo
VisuAlgo was conceptualised in 2011 by Associate Professor Steven Halim (NUS School of Computing) as a tool to help his students better understand data structures and algorithms, by allowing them to learn the basics on their own and at their own pace. Together with his students from the National University of Singapore, a series of visualizations were developed and consolidated, from simple sorting algorithms to complex graph data structures. Though specifically designed for the use of NUS students taking various data structure and algorithm classes (CS1010/equivalent, CS2040/equivalent (inclusive of IT5003)), CS3230, CS3233, and CS4234), as advocators of online learning, we hope that curious minds around the world will find these visualizations useful as well.