

The Twilight of the Polls? A Review of Trends in Polling Accuracy and the Causes of Polling Misses
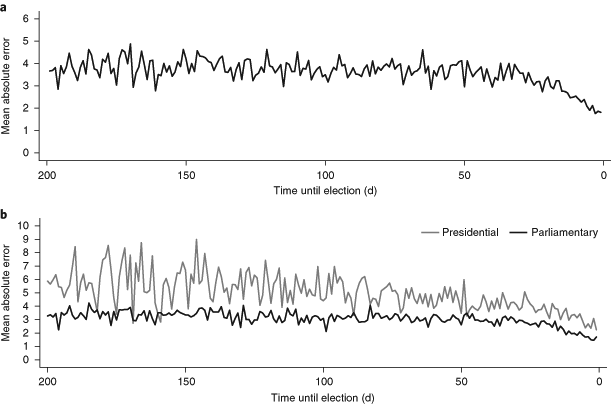
Polls have had a number of high-profile misses in recent elections. We review the current polling environment, the performance of polls in a historical context, the mechanisms of polling error, and the causes of several recent misses in Britain and the US. Contrary to conventional wisdom, polling errors have been constant over time, although the level of error has always been substantially beyond that implied by stated margins of error. Generally, there is little evidence that voters lying about their vote intention (so-called ‘shy’ voters) is a substantial cause of polling error. Instead, polling errors have most commonly resulted from problems with representative samples and weighting, undecided voters breaking in one direction, and to a lesser extent late swings and turnout models. We conclude with a discussion of future directions for polling both in terms of fixing the problems identified and new approaches to understanding public opinion.

Election polling errors across time and space
Are election polling misses becoming more prevalent? Are they more likely in some contexts than others? Here we undertake an over-time and cross-national assessment of prediction errors in pre-election polls. Our analysis draws on more than 30,000 national polls from 351 general elections in 45 countries between 1942 and 2017. We proceed in the following way. First, building on previous studies, we show how errors in national polls evolve in a structured way over the election timeline. Second, we examine errors in polls in the final week of the election campaign to assess performance across election years. Third, we undertake a pooled analysis of polling errors—controlling for a number of institutional and party features—that enables us to test whether poll errors have increased or decreased over time. We find that, contrary to conventional wisdom, the recent performance of polls has not been outside the ordinary. However, the performance of polls does vary across political contexts and in understandable ways.

An Examination of Ranked Choice Voting in the United States, 2004-2022
From the perspective of social choice theory, ranked-choice voting (RCV) is known to have many flaws. RCV can fail to elect a Condorcet winner and is susceptible to monotonicity paradoxes and the spoiler effect, for example. We use a database of 182 American ranked-choice elections for political office from the years 2004-2022 to investigate empirically how frequently RCV's deficiencies manifest in practice. Our general finding is that RCV's weaknesses are rarely observed in real-world elections, with the exception that ballot exhaustion frequently causes majoritarian failures.

Voter Studies | Australian Election Study
The AES routinely collects data among a nationally representative sample of voters and among major party candidates standing for election (the latter is the Australian Candidate Study – ACS). Both the voter and candidate instruments combine a common set of questions. More details on the general methodology used are detailed below, and specific information about the methods used for a particular year is available from the information page for that wave.
Election Protection Hotline: Voting Help for 2026 Midterms
Facing voting problems? Call or text Election Protection at 866-687-8683 for help with polling information and ballot access before the 2026 midterms.
Preliminary ranked choice voting results in Alaska’s 2026 elections - FairVote
On November 3, Alaskans went to the polls in critical ranked choice voting elections for Congress, governor, and state legislature.

BallotReady: Where you go before you vote
Your go-to source for nonpartisan election information. Register to vote, explore the entire ballot, find your polling place, and more, all in one place.
FiftyPlusOne - Latest Political Polls and Averages
A comprehensive list of polls and polling averages for elections and politician approval.

FiftyPlusOne - Latest Political Polls and Averages
A comprehensive list of polls and polling averages for elections and politician approval.
Unofficial Results - 2026 Referendum
Reporting percentage is calculated based on Voting Area/Locations activity. A Voting Area/Location is considered "reported" once at least one question for that Voting Area/Location has been submitted. A 100% completion rate indicates that every Voting Area/Location has started, but does not necessarily mean every individual question for those Voting Area/Locations has been completed.
Priorities | celeste4sos.com
The right to vote, better representation and election integrity.

Elections Archive
A free, open archive of election results, from national totals to single precincts, reaching back to 1787.

New YouGov/Economist poll out this AM has Democrats up 11 points on the House vote among likely voters. This is with named candidates, not the usual "generic ballot," which in my testing with CES data is typically more accurate in forecasting outcomes d3nkl3psvxxpe9.cloudfront.net/documents/econTabReport_SlcWd…
