

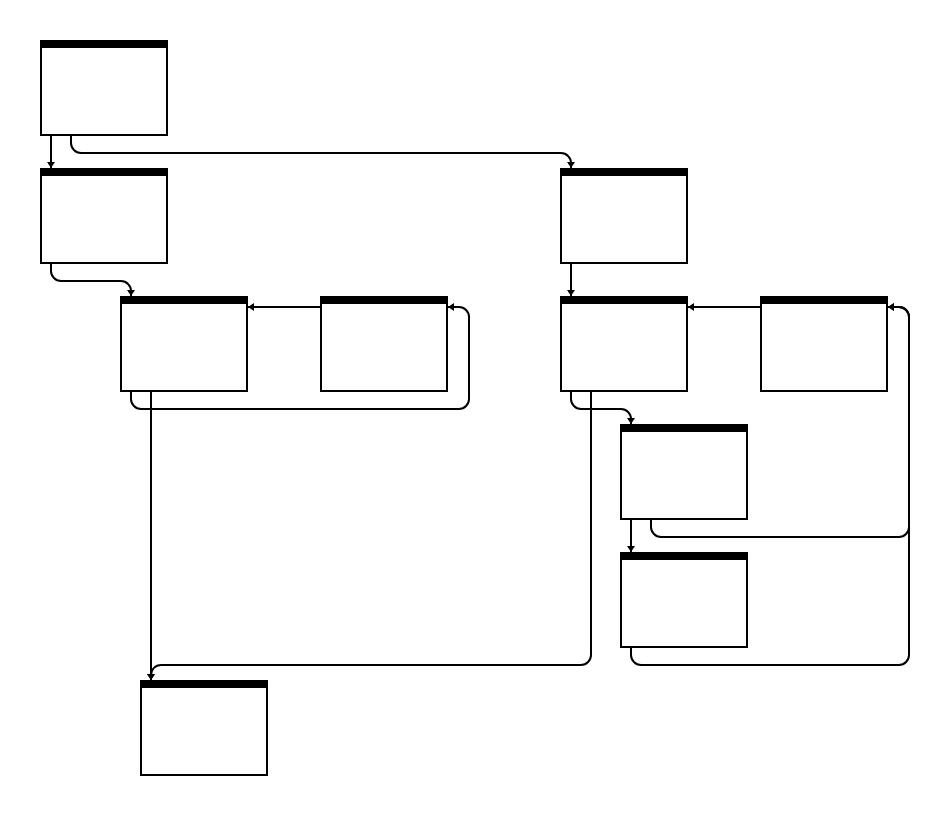
Exploring a new layout algorithm for control flow graphs.
Flowchart Maker & Online Diagram Software
Documentation — Terminal Graph
Download Terminal Graph beta, learn the shortcuts, nodes, and dataflow model.
GitHub - HEmile/juggl: An interactive, stylable and expandable graph view for Obsidian. Juggl is designed as an advanced 'local' graph view, where you can juggle all your thoughts with ease.
An interactive, stylable and expandable graph view for Obsidian. Juggl is designed as an advanced 'local' graph view, where you can juggle all your thoughts with ease. - GitHub - H...
Security-first diagramming for teams | draw.io
Free, open source diagramming application with 100M+ users. Store your data wherever you want—we can't access it.
Terminal Graph — A spatial development environment for macOS
See everything. Switch nothing. Terminals, browsers, editors, and notes on one infinite canvas with dataflow connections. Native macOS.
The 34th International Symposium on Graph Drawing and Network Visualization
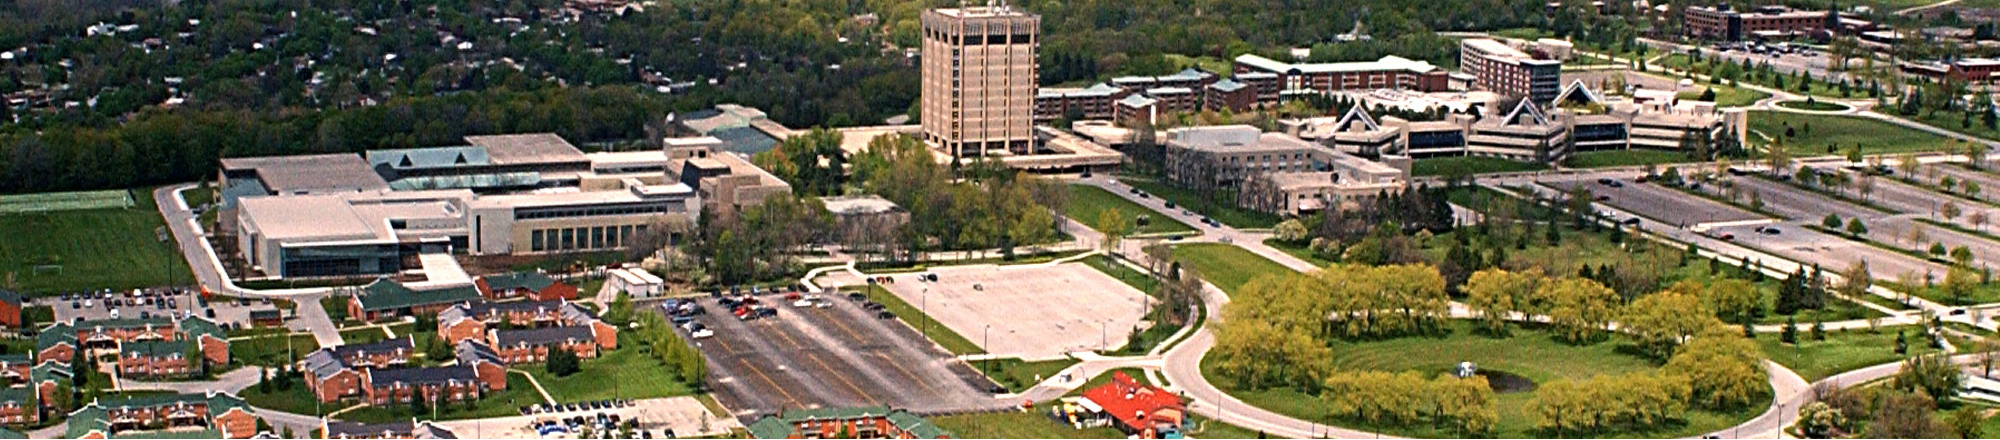
The 34th International Symposium on Graph Drawing and Network Visualization will be held at Brock University in St. Catharines, Ontario, Canada from August 17-21, 2026. A PhD school will take place on August 17-18, 2026.
Semble Multi-User Graph Explorer
Leaving technical preview | GraphQL
After over a year of being open sourced we’re bringing GraphQL out of “technical preview” and relaunching graphql.org.
Structured planning and debugging | Proceedings of the 5th international joint conference on Artificial intelligence - Volume 2
We introduce a new approach to planning in STRIPS-like domains based on constructing and analyzing a compact structure we call a Planning Graph. We describe a new planner, Graphplan, that uses this paradigm. Graphplan always returns a shortest-possible ...
Sigma.js
a JavaScript library aimed at visualizing graphs of thousands of nodes and edges
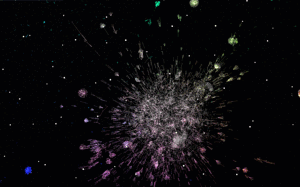
Code Galaxies Visualization
Code galaxies visualization allows you to explore huge graphs of software package managers (npm, go, ruby gems, composer, etc.)
G6 Graph Visualization Framework in JavaScript
G6 is a graph visualization framework with simplicity and convenience. Based on the ability of customization, it provides elegant graph visualization solutions, helping developers build applications for graph visualization, analysis, and editing.
