

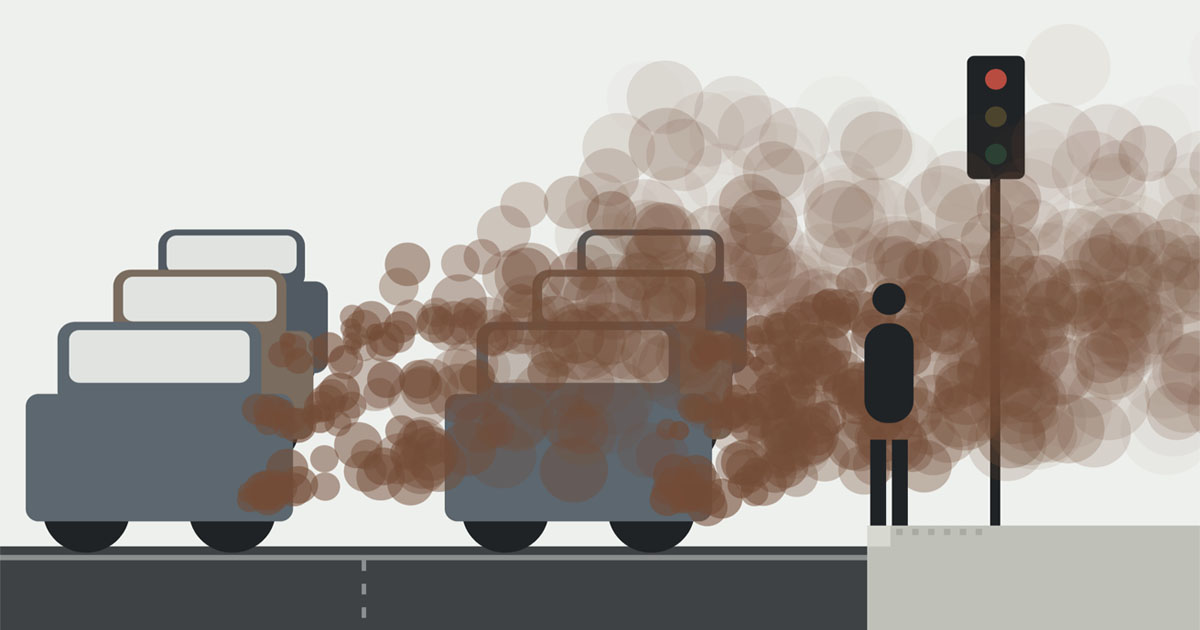
Every busy road produces a cloud of pollution you can't see. Where you stand in it matters more than most people might realise.
Paris said au revoir to cars. Air pollution maps reveal a dramatic change.
Air pollution fell substantially as the city restricted car traffic and made way for parks and bike lanes.

Speedcam Anywhere
Vehicle exhaust emissions - CO2, PM2.5 and NOx - are highest during acceleration. Microplastic particulates from tire emissions are highest during braking, accelerating and cornering quickly. In urban areas, vehicles accelerate and decelerate repeatedly due to junctions and traffic. Allowing for the emissions when vehicles are accelerating and they typically have the lowest NOx and CO2 emissions, and the best mpg, when driven at maximum speeds of 15-20mph. Particulate Matter (PM2.5) from tyre wear and brake pad wear is a lot higher when decelerating from higher speeds, and also from cornering at higher speeds. Because of the extra emissions during acceleration, NOx and CO2 go up rapidly when driving at higher speeds in urban areas.
De la pollution de l’air à l’usage du vélo, l’impact sanitaire des choix d’urbanisme évalué
L’agence Santé publique France publie jeudi une étude menée dans trois métropoles pour évaluer les leviers environnementaux permettant de réduire la mortalité des populations urbaines.
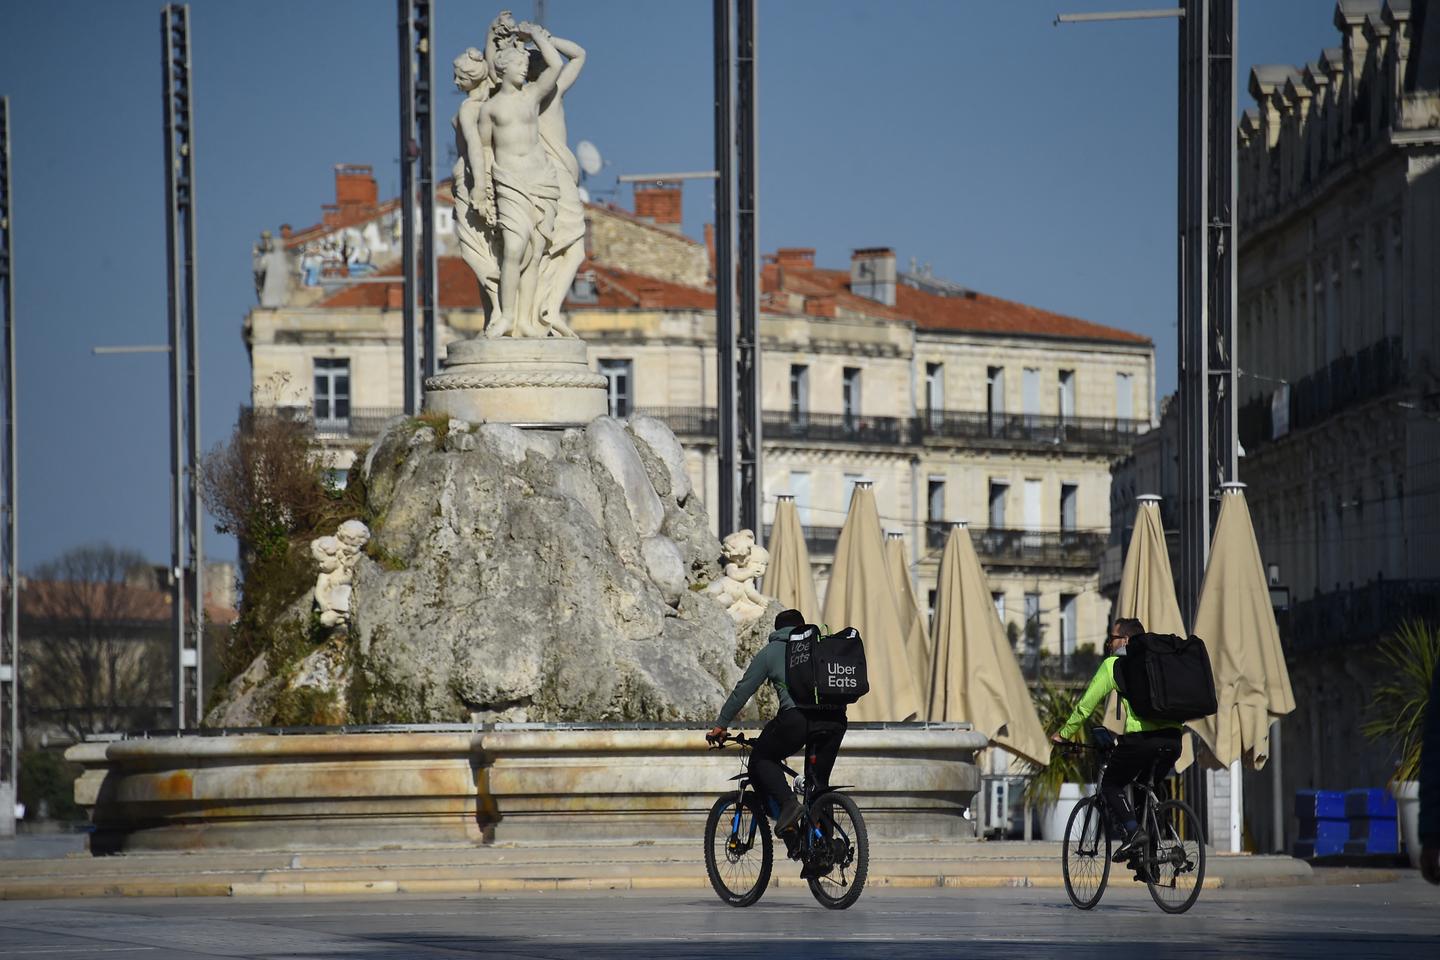
Urban congestion relief experiments through routing-app interventions
Traffic congestion remains a persistent challenge for urban mobility, increasing travel delays and elevating CO2 emissions. The widespread use of smartphones and GPS navigation creates new opportunities to mitigate congestion through routing optimizations in apps, yet real-world evidence for the effectiveness of such interventions is limited. Here we report large-scale empirical experiments evaluating routing-based traffic interventions on ~100 highly congested road segments across 10 major US cities. By rerouting a small share of Google Maps trips from targeted congested highway and arterial segments to less congested alternatives of equivalent road-classes with comparable travel times, we observe a city-average 2% increase in vehicle speeds on the intervened segments, along with improved travel times 0.7% and potential annual reductions exceeding 1,000 tons of CO2-equivalent emissions per city in the majority of studied locations. These findings provide evidence that marginal routing interventions involving a small proportion of vehicles can measurably enhance overall road network efficiency, offering a practical pathway to easing congestion and advancing urban sustainability.
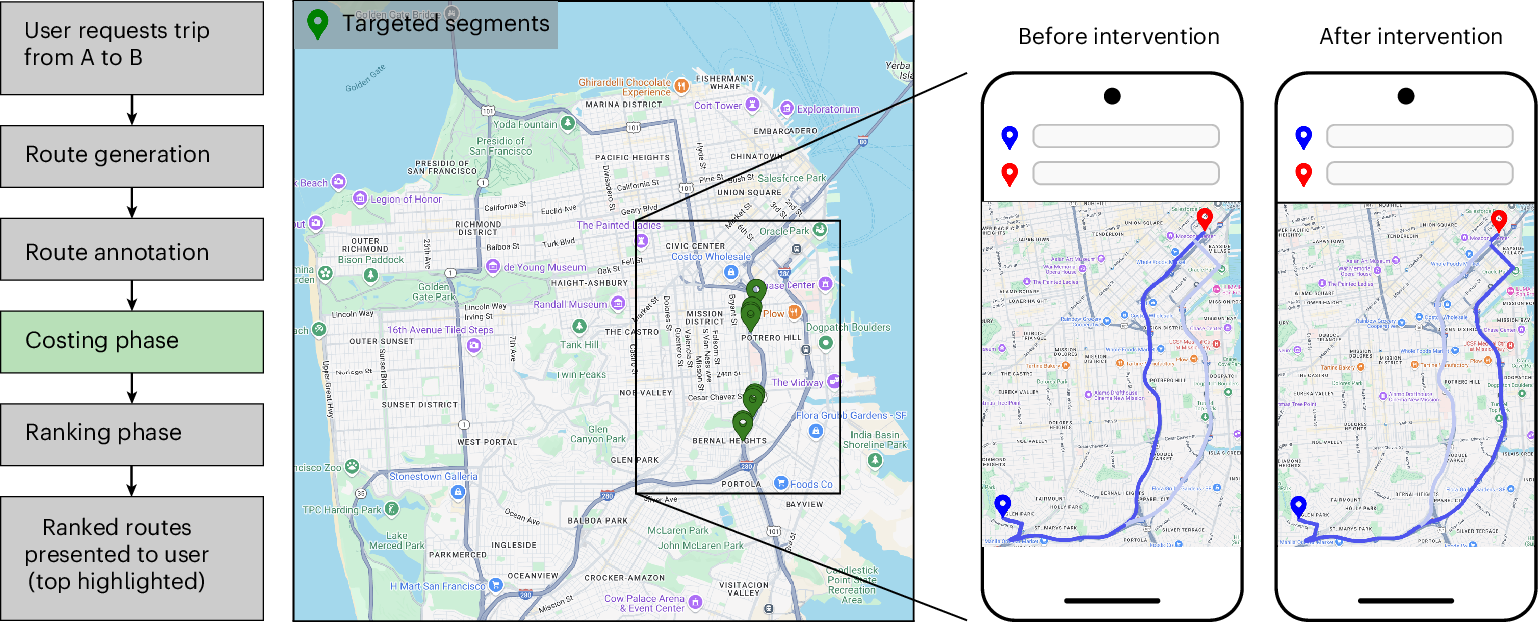
Britain’s cars and SUVs are growing bigger – but there is a way to stop this deadly ‘carspreading’ | Christian Wolmar
Larger vehicles crowd our roads and are far more dangerous to pedestrians. Let’s curb them before they do even more damage, says says transport commentator Christian Wolmar
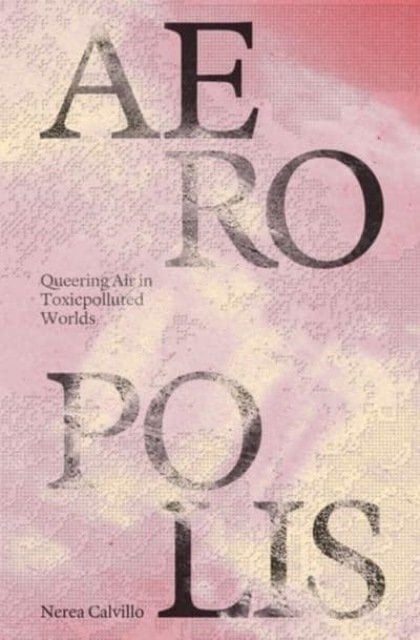
Aeropolis – Queering Air in Toxicpolluted Worlds
Check out Aeropolis – Queering Air in Toxicpolluted Worlds - How do we get to know air? <i>Aeropolis: Queering Air in Toxicpolluted Worlds</i> offers a speculative and interdisciplinary framework to reorient common understandings of air and air pollution as matter “out there.” <i>Aeropolis</i> contests regimes of managing air which ultimately operate toward upholding dominant modes of world-making that are dependent on forms of exclusion and inequity. Instead, <i>Aeropolis</i> proposes that air is thought of as a city, to center its social, cultural, political, ecological entanglements. Drawing upon feminist technoscience and queer ecological frameworks, <i>Aeropolis</i> moves away from solutions toward a methodology of “designing-thinking-making” that redirects and connects our understandings of air—as designers, as citizens—with ongoing struggles for just futures. <br /><br />Moving through a series of design interventions, histories of air, and theoretical coordinates, <i>Aeropolis</i> thinks with air across its many forms—through smog and dust, bodies and breath, pollen and weeds, and from urban design to geopolitics, polluted environments to open data, parks to aerial infrastructures. It insists that we acknowledge the diversity of air and its relation to humans, non-humans, and environments, both physically and affectively. That we become sensible to air by following its unruliness—by living, breathing, seeing, holding, touching, queering airs.<br /><br />With contributions from María Puig de la Bellacasa and Timothy K. Choy. by Nerea Calvillo on Bookshop.org UK!
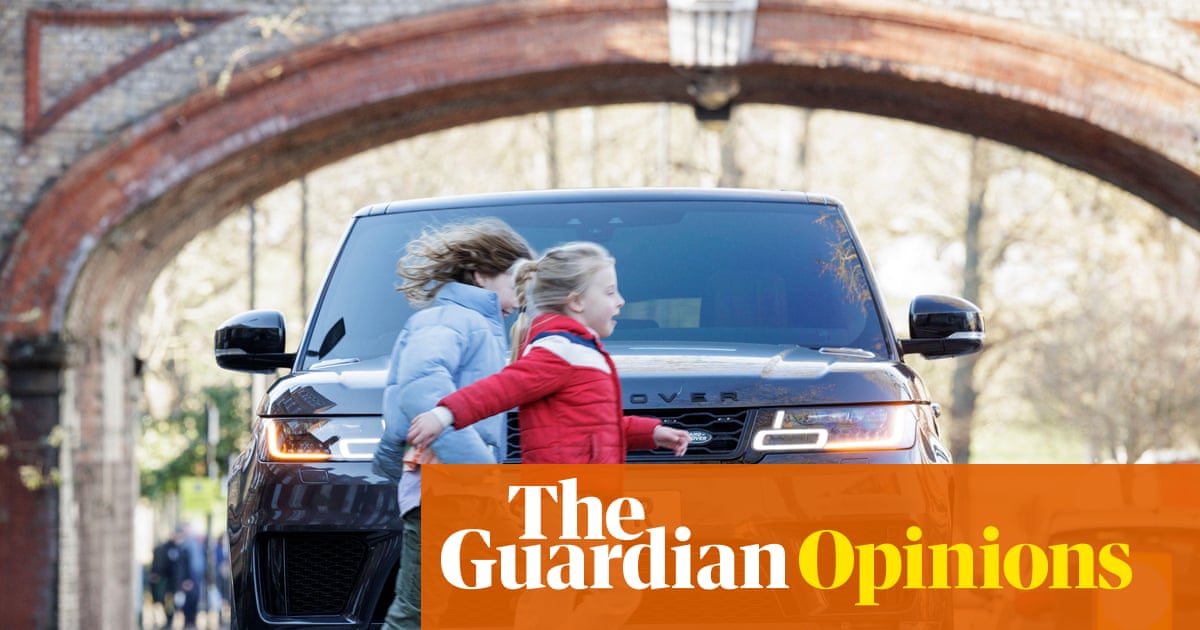
Motorists in one of a Montreal’s busiest boroughs support bike lanes
There are real tensions between cyclists, motorists and pedestrians sharing the road, but Montrealers believe traffic-calming measures — bike lanes, speed humps and curb extensions — can improve safety for all road users.

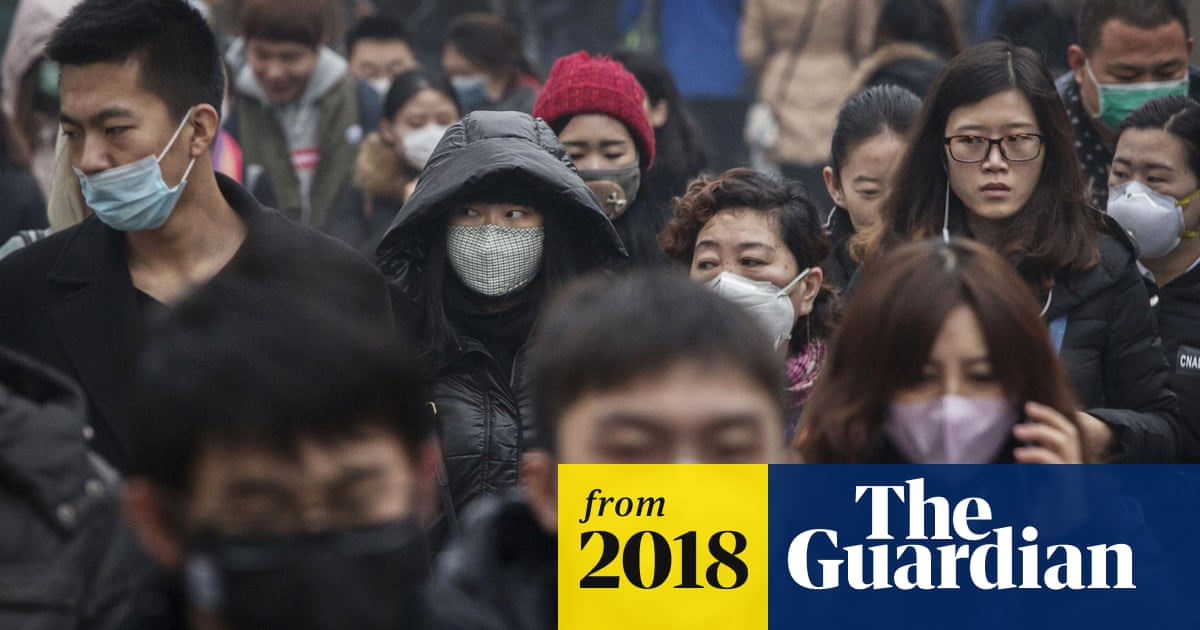
Air pollution causes ‘huge’ reduction in intelligence, study reveals
Impact of high levels of toxic air ‘is equivalent to having lost a year of education’
Exploring the social life of urban spaces through AI
We analyze changes in pedestrian behavior over a 30-y period in four urban public spaces located in New York, Boston, and Philadelphia. Building on William Whyte’s observational work, which involved manual video analysis of pedestrian behaviors, we employ computer vision and deep learning techniques to examine video footage from 1979–80 and 2008–10. Our analysis measures changes in walking speed, lingering behavior, group sizes, and group formation. We find that the average walking speed has increased by 15%, while the time spent lingering in these spaces has halved across all locations. Although the percentage of pedestrians walking alone remained relatively stable (from 67% to 68%), the frequency of group encounters declined, indicating fewer interactions in public spaces. This shift suggests that urban residents are using streets as thoroughfares rather than as social spaces, which has important implications for the role of public spaces in fostering social engagement.

Designing a wayfinding concept for Vancouver's Skytrain system.
I wasn’t always a big fan of public transport.
Cycling Toward a Cooler Toronto | The Power of Bike Lanes
Air Pollution Mask
Reusable urban air pollution mask with certified 99.99% PM2.5 filtration against traffic fumes, road dust and smog. Breathable, washable, built for daily city wear.

The Deadly Rise of Giant Trucks and S.U.V.s
The vehicles on American roads have grown larger — and they are killing thousands more pedestrians, a Times investigation found.

Find Protests Near You - Updated Daily | find a protest
Find protests and solidarity events near you — updated daily. Discover local rallies, vigils, teach-ins and justice actions happening this week and weekend.
The Distributional Effects of Low Emission Zones: Who Benefits from Cleaner Air?
Low emission zones (LEZs) are a key instrument for improving air quality in cities, but it remains unclear how their air-quality benefits are distributed. We study 58 LEZs implemented in Germany since 2008 and decompose their benefit incidence along three margins: policy exposure, heterogeneous treatment effects, and monetary valuation assumptions. Using high-resolution spatial pollution concentration and socio-economic data in a difference-in-differences design, we document systematic differences in estimated PM2.5 reductions across neighborhoods. Within LEZs, residents with a German name origin experience larger reductions in PM2.5 concentration. Residents with a foreign name origin, however, are substantially more likely to live in LEZ areas, resulting in larger average air-quality improvements from a nationwide perspective. Across income groups, low-income residents experience larger pollution reductions and a disproportionately large share of the monetized benefits within LEZs. Nationwide, however, benefit incidence is close to proportional, again due to offsetting policy exposure. Overall, these findings suggest that place-based environmental policy can have nuanced distributional implications across population groups and depend jointly on the three distributional effect margins we identify.
