A typed, tree-shakable chart grammar for SVG and Canvas. Compose marks, views, scales, transforms, interactions, and motion with compact primitives or D3-compatible inputs.
TanStack Start 1.0 is Stable | TanStack Blog
TanStack Start 1.0 is stable and ready for production.
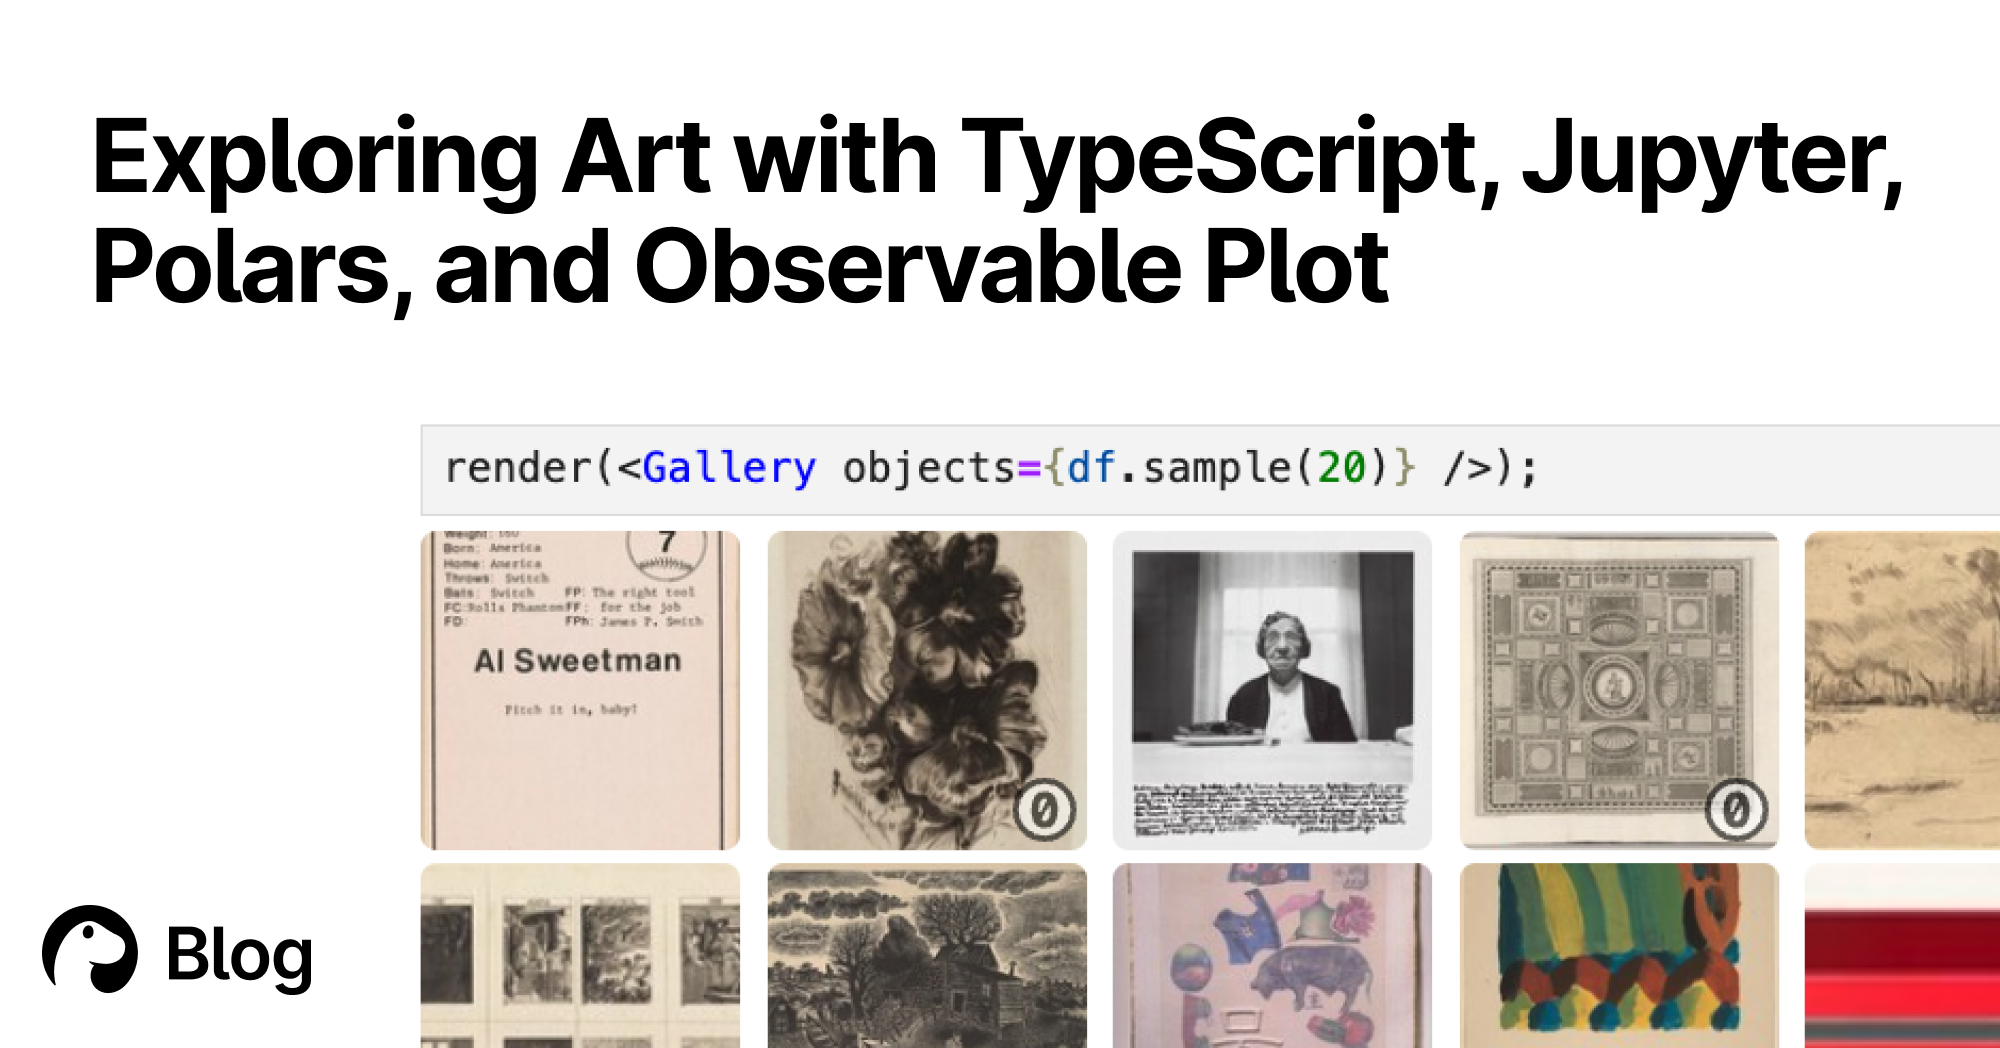
Exploring Art with TypeScript, Jupyter, Polars, and Observable Plot | Deno
With Deno's Jupyter support, you can explore, interact, and create interactive charts with TypeScript and HTML. Here's a tutorial featuring data of over 130,000 famous artworks.
TanStack/ai
🤖 Type-safe, provider-agnostic TypeScript AI SDK for streaming chat, tool calling, agents, and multimodal apps across OpenAI, Anthropic, Gemini, React, Vue, Svelte, and Solid.
Chart Design Principles | Hands-On Data Visualization
Tell your story and show it with data, using free and easy-to-learn tools on the web. This introductory book teaches you how to design interactive charts and customized maps for your website, beginning with easy drag-and-drop tools, such as Google Sheets, Datawrapper, and Tableau Public. You will also gradually learn how to edit open-source code templates built with Chart.js, Highcharts, and Leaflet on GitHub. Follow along with the step-by-step tutorials, real-world examples, and online resources. This book is ideal for students, non-profit organizations, small business owners, local governments, journalists, academics, or anyone who wants to tell their story and show the data. No coding experience is required.
A High-Level Grammar of Interactive Graphics
Vega-Lite - a high-level grammar for statistical graphics. Vega-Lite provides a higher-level grammar for visual analysis, comparable to ggplot or Tableau, that generates complete Vega specifications. Vega-Lite specifications consist of simple mappings of variables in a data set to visual encoding channels such as x, y, color, and size. These mappings are then translated into detailed visualization specifications in the form of Vega specification language. Vega-Lite produces default values for visualization components (e.g., scales, axes, and legends) in the output Vega specification using a rule-based approach, but users can explicit specify these properties to override default values.
TanStack Table
Supercharge your tables or build a datagrid from scratch for TS/JS, React, Vue, Solid, Svelte, Qwik, Angular, and Lit while retaining 100% control over markup and styles.

@tomlarkworthy/svg-lens
The drawing syncs to the code and vice versa. Switch between using code and UI. Built on composable lens [Foster et al. 2007] and edit-lens [Hofmann et al. 2012] theory, but applied in the string domain so unknown semantics like SVG animations are preserved without parsing. Follows the path of Sketch-n-Sketch [Chugh et al. 2016] [Hempel et al. 2019] but applied to an existing image format: SVG. Generated with a novel prompting strategy of requesting an LLM to use property checking against mathematical laws as a architecture, leading to strong implementation consistency over an expansive domain.
VisQuill – Reactive Geometry for Interactive Data Visualization
VisQuill lets you explore data through interactive visuals or build your own using a reactive geometry SDK. Create geospatial and interactive visual systems with real-time updates.

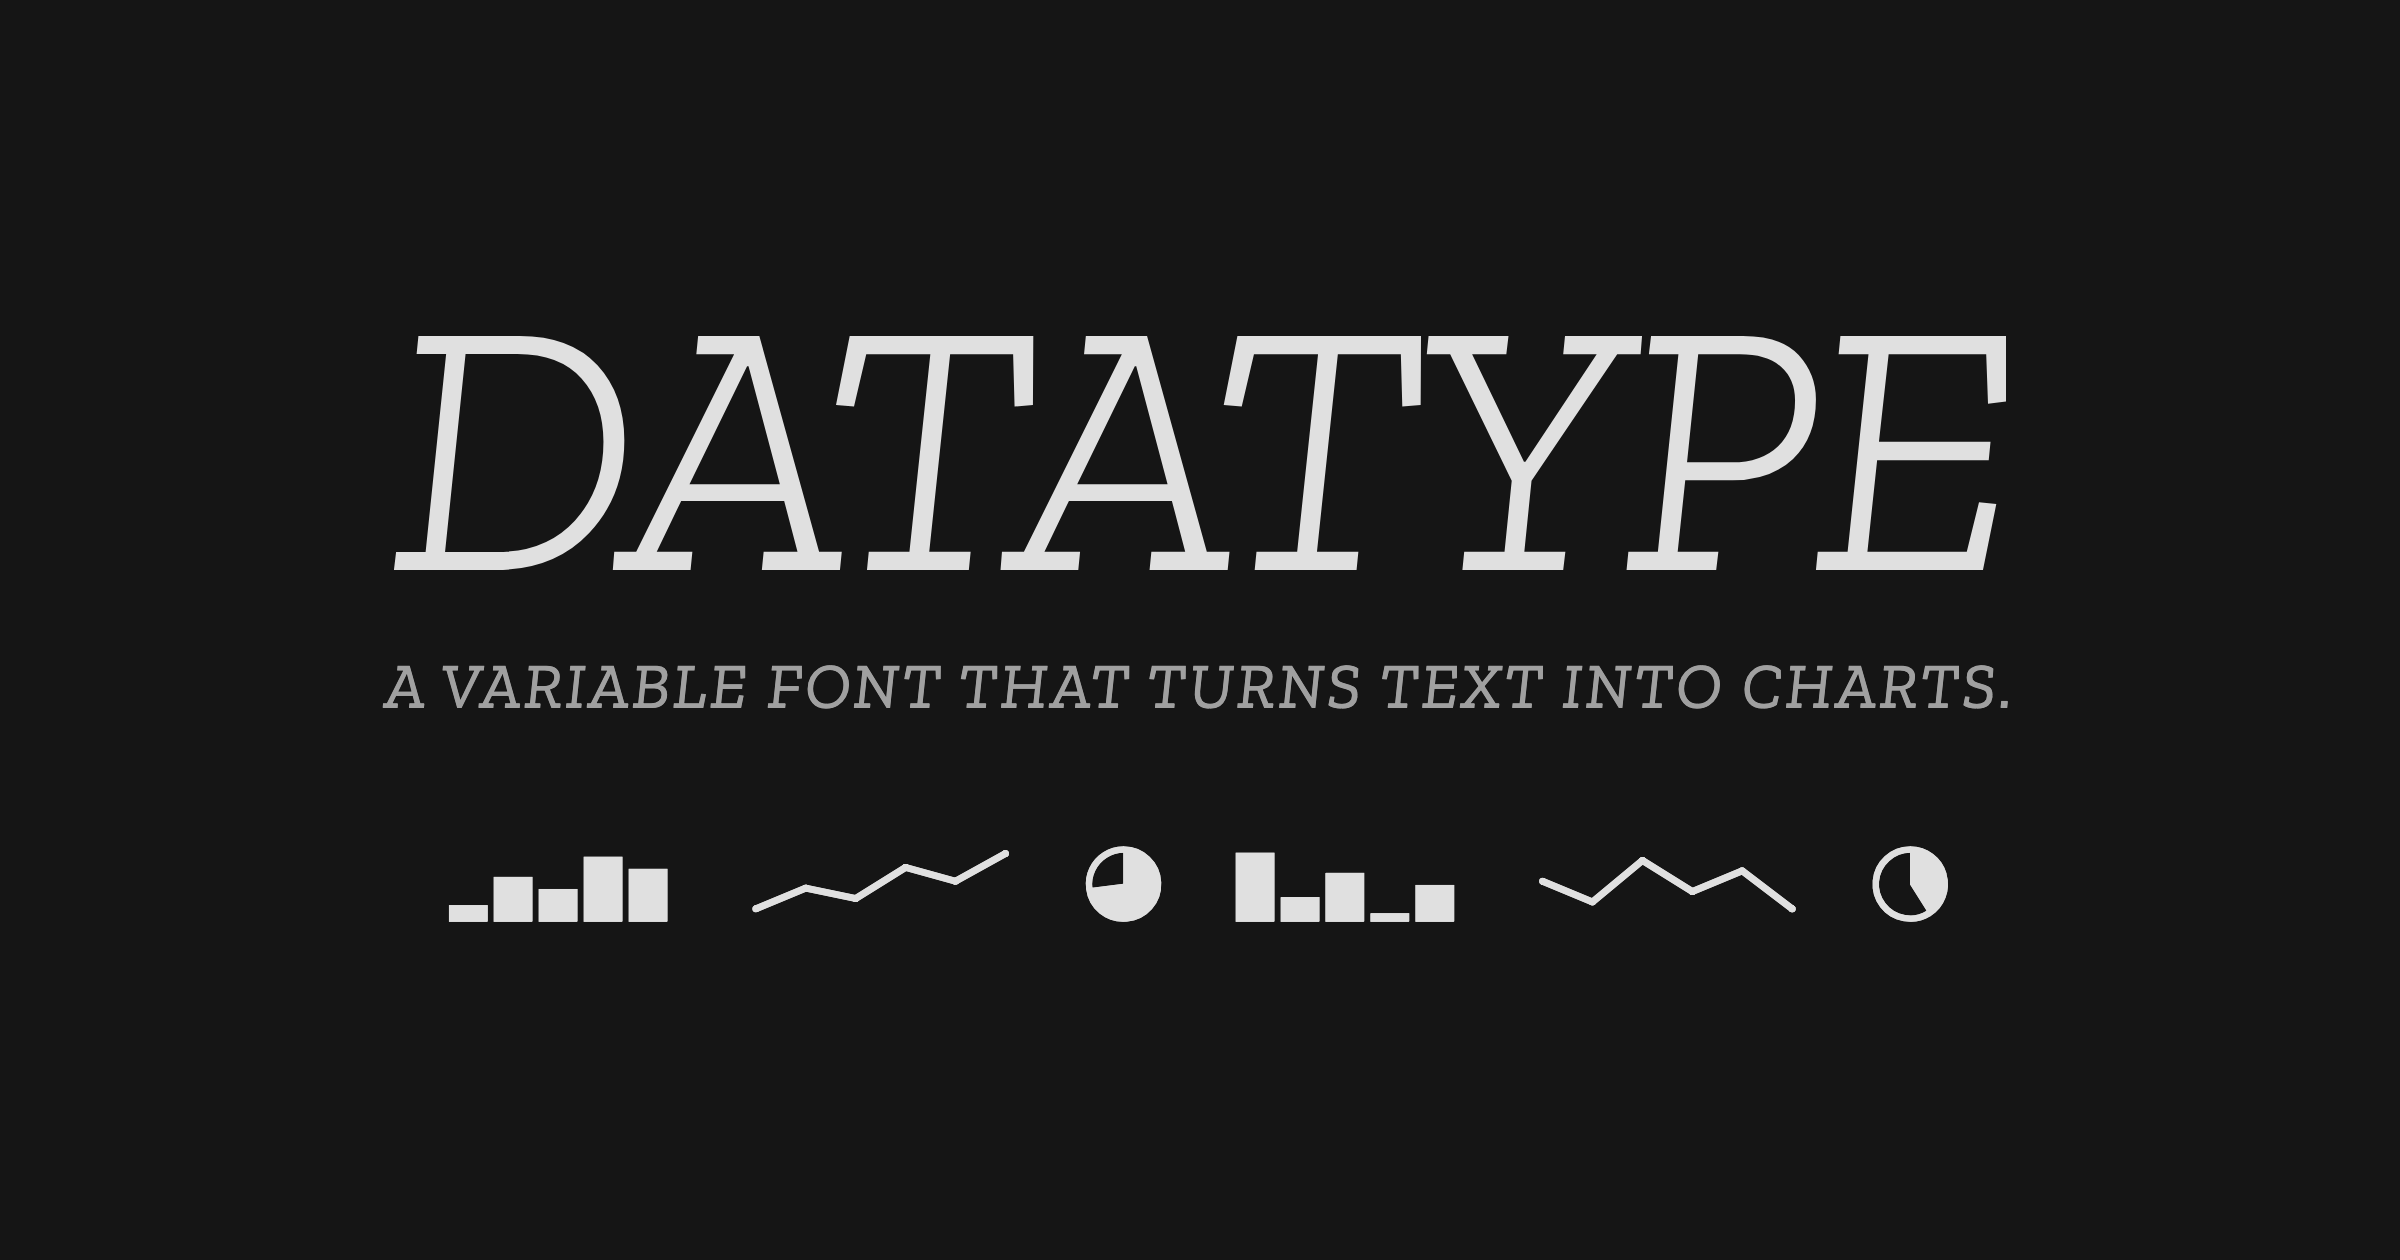
Datatype — variable font that turns text into charts
An OpenType variable font that turns simple text expressions into inline charts. No JavaScript, no images — just type.
GitHub - observablehq/plot: A concise API for exploratory data visualization implementing a layered grammar of graphics
A concise API for exploratory data visualization implementing a layered grammar of graphics - observablehq/plot
visualising data structures and algorithms through animation - VisuAlgo
VisuAlgo was conceptualised in 2011 by Associate Professor Steven Halim (NUS School of Computing) as a tool to help his students better understand data structures and algorithms, by allowing them to learn the basics on their own and at their own pace. Together with his students from the National University of Singapore, a series of visualizations were developed and consolidated, from simple sorting algorithms to complex graph data structures. Though specifically designed for the use of NUS students taking various data structure and algorithm classes (CS1010/equivalent, CS2040/equivalent (inclusive of IT5003)), CS3230, CS3233, and CS4234), as advocators of online learning, we hope that curious minds around the world will find these visualizations useful as well.
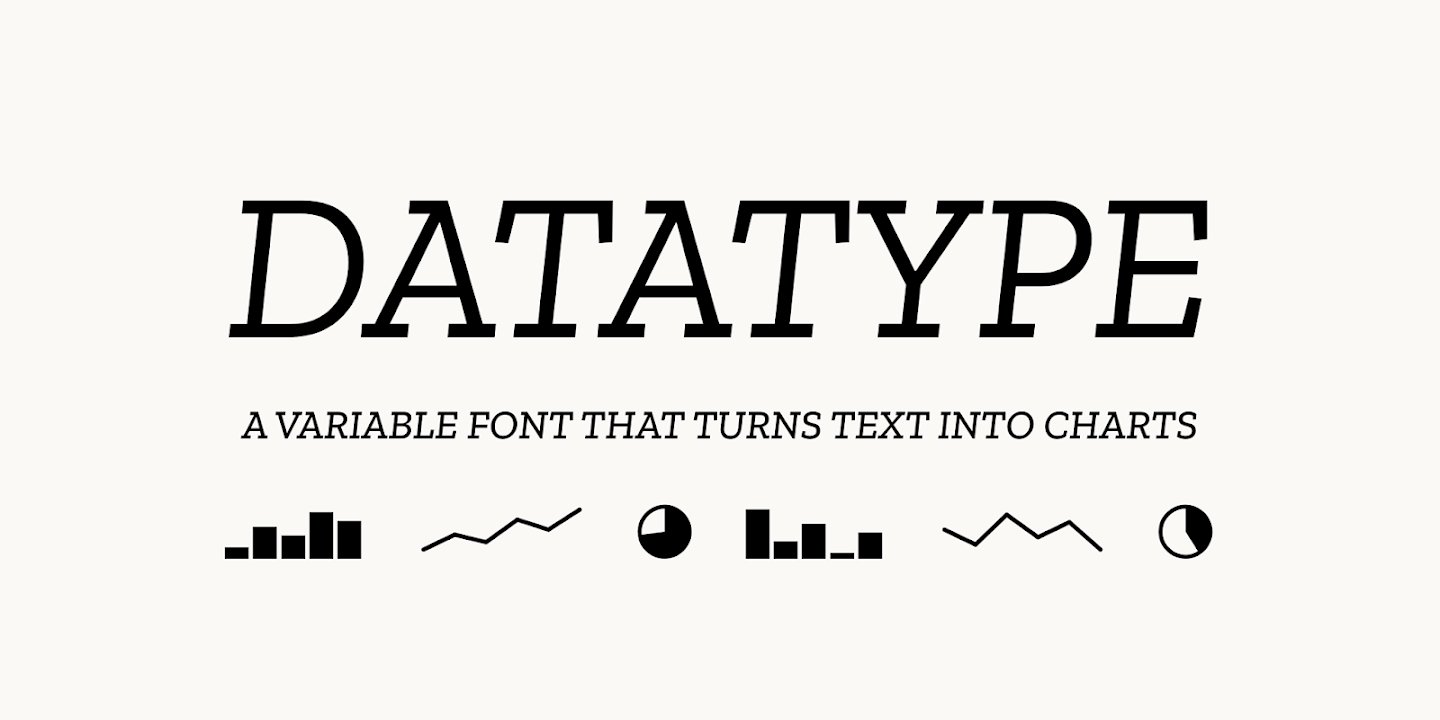
Meet Datatype, my new font that turns text into charts. Available on Google Fonts and of course in Workspace. Simple syntax like {b:10,25,7,95} turns into sparklines, pie charts, and bar charts that look great in your docs, slides, and sheets. https://t.co/0cgEkOcFfM https://t.co/wViF3fPtMr
Meet Datatype, my new font that turns text into charts. Available on Google Fonts and of course in Workspace.Simple syntax like {b:10,25,7,95} turns into sparklines, pie charts, and bar charts that look great in your docs, slides, and sheets.https://t.co/0cgEkOcFfM pic.twitter.com/wViF3fPtMr— Frank Tisellano (@franktisellano) March 12, 2026
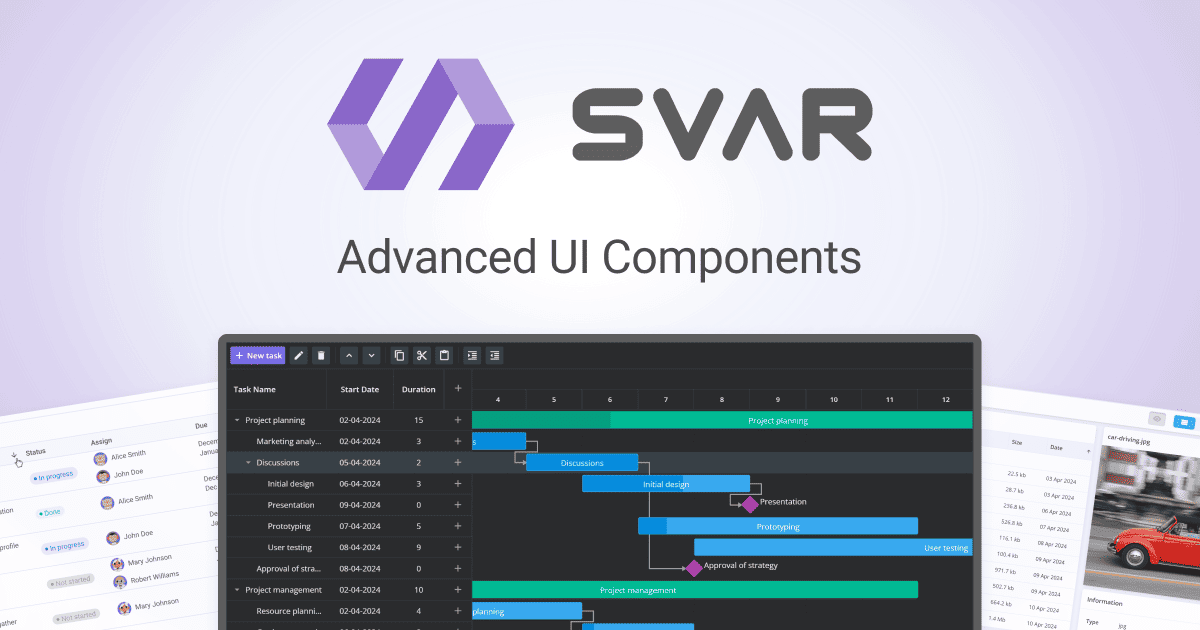
SVAR Svelte UI Components Library
Build modern, responsive web apps with open-source SVAR Svelte UI components: Data Grid, Gantt Chart, and more! Lightweight, fast, customizable.