

🎉 Launching online today: "Calculating Empires: A Genealogy of Technology and Power since 1500." Dive into our large-scale interactive visualization exploring how technical and social structures co-evolved over five centuries. 🧵 https://t.co/Z6sfaCevDf— Kate Crawford (@katecrawford) June 20, 2024
Calculating Empires: A Genealogy of Technology and Power since 1500
Explore how technical and social structures co-evolved over five centuries in this large-scale research visualization.
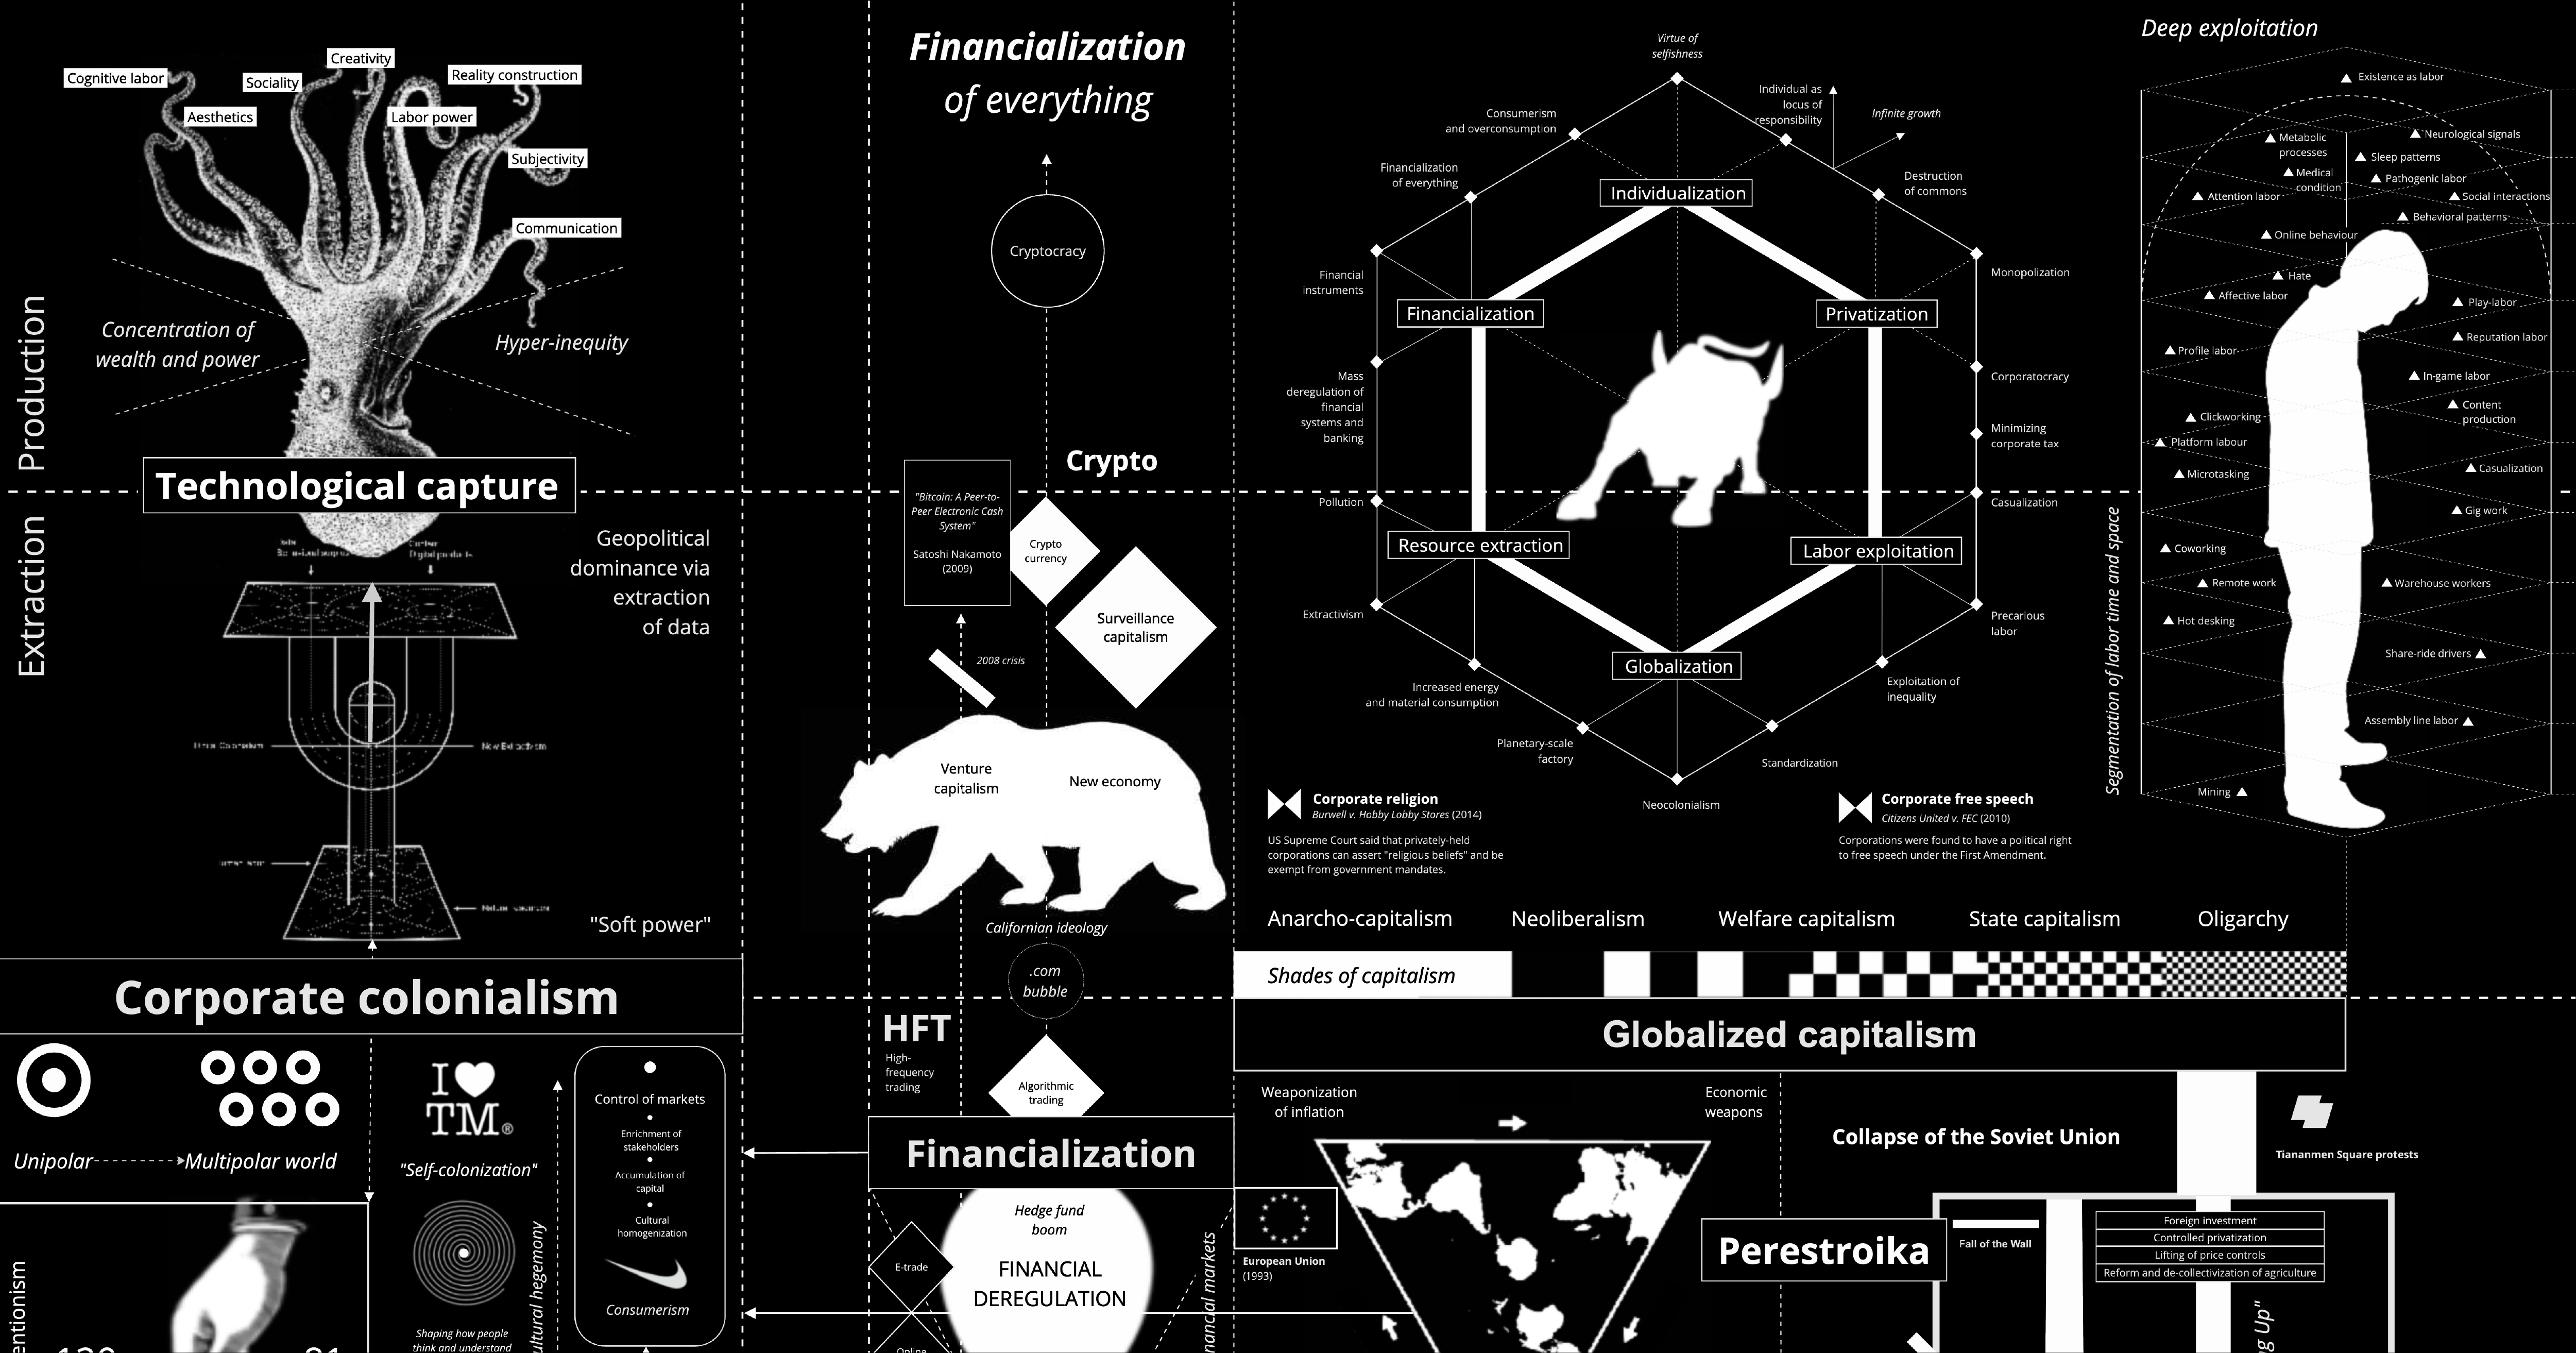
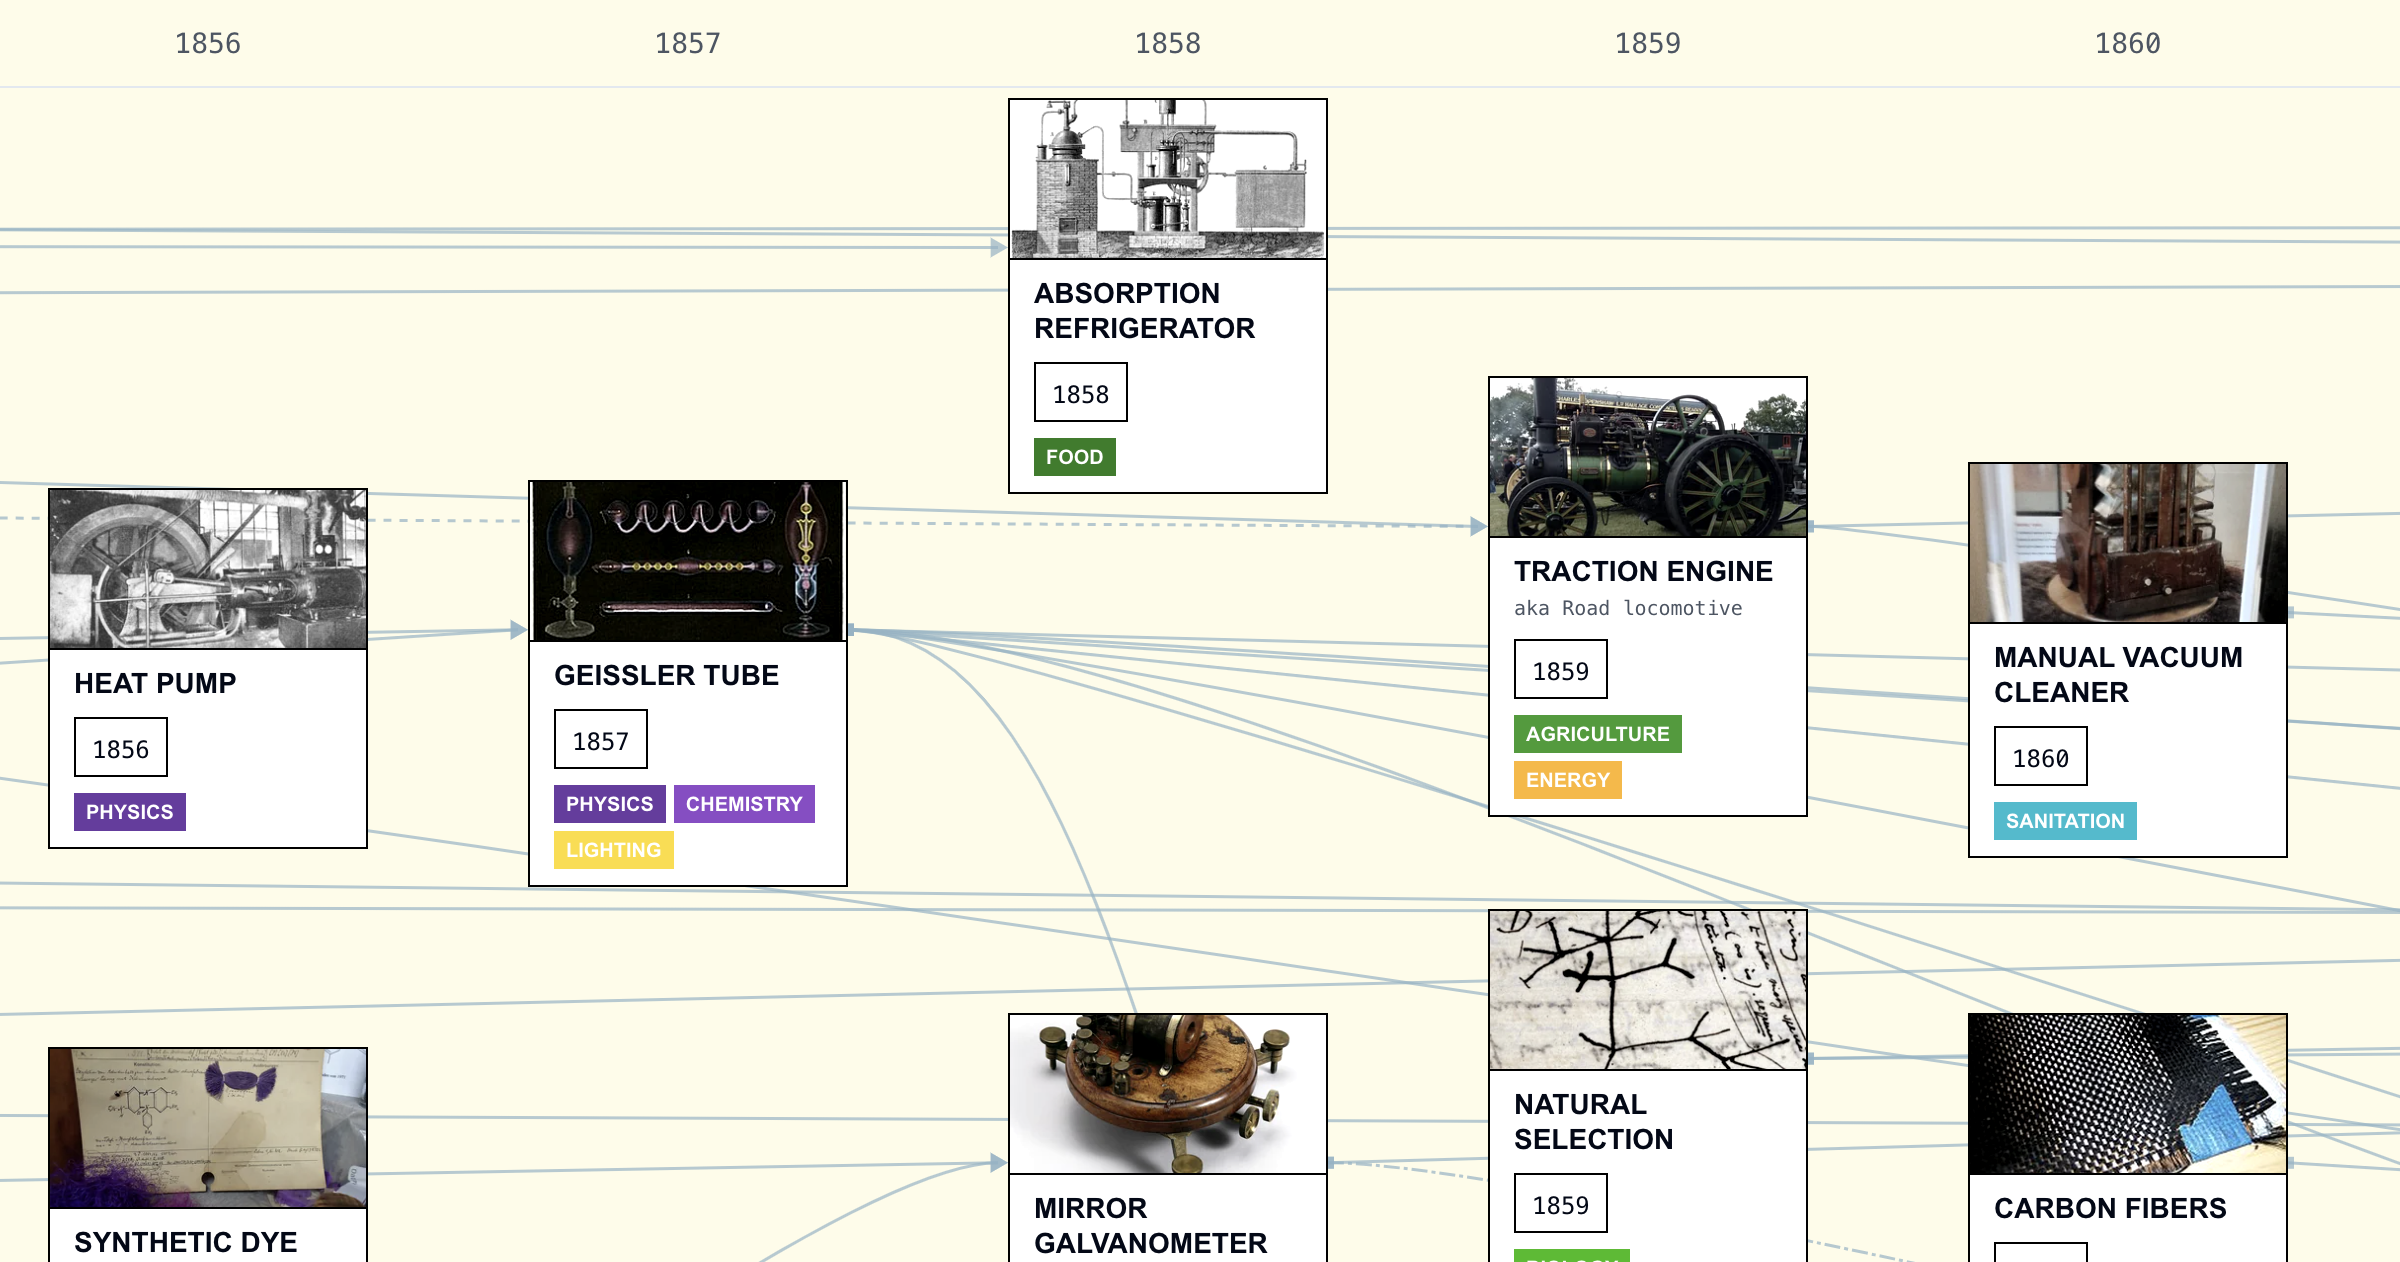
Capitalism Tech Stack Map — A Cross-Civilization Infographic (D3 Force)
ChinaPower Project
Unpacking the complexity of China's rise in the world through interactivity and visualization.

Empire: World History
Empire: World History
History Podcast · Updated twice weekly · The rise and fall of empires and the events that shaped world history. William Dalrymple and Anita Anand explore the intricate stories of revolutions, imperial wars, and the people who built and lost…

Cosmograph: Beautiful Visualization and Analytics | Cosmograph
Beautiful Visualization and Analytics

AI’s Imperial Agenda
“Empire of AI” author Karen Hao on how Silicon Valley’s young AI companies parallel colonial empires of old.

Adventures in Mapping Digital Empires
For years, Tactical Tech has worked to understand and visualise Big Tech's impact on society. In this piece, you will be taken on a journey through the different formats, narratives and visual representations Tactical Tech has used to tell the story behind the acquisitions, mergers and investments of the Big Tech Google, Amazon, Facebook, Apple and Microsoft. Read to learn about our provocation design approach to promote digital thinking.

Exhibit Home
An exhibition that examines the 19th-century roots of information graphics.

Part I: The Next Great Online Community
There’s a lack of innovation in community software. Let's dive into internet history, and get inspired!
Build, gather, brawl, repeat: The history of real-time strategy games
As we wait on a new Age of Empires this fall, let's revisit the RTS genre's highs and lows.
The 34th International Symposium on Graph Drawing and Network Visualization
The 34th International Symposium on Graph Drawing and Network Visualization will be held at Brock University in St. Catharines, Ontario, Canada from August 17-21, 2026. A PhD school will take place on August 17-18, 2026.

Agent Economies | Interactive AI Network Visualization
Explore the future of AI agent economies through an interactive network visualization representing autonomous systems that collaborate and evolve.
Flint: A Visualization Language for the AI Era
18 Years of Internet Explorer Design History - 54 Images - Version Museum
A comprehensive visual history of Microsoft Internet Explorer from 1995 to 2013. See a gallery of the Microsoft Internet Explorer evolution from the beginning to 2013.