

The Mapping Police Violence organization just released a new data platform documenting over 1,000,000 cases of police use of force nationwide across 58% of the U.S. This is the largest public database of its kind, explore the data at https://t.co/a2XBv1ANOv. Here’s what the data…— Samuel Sinyangwe (@samswey) August 28, 2024
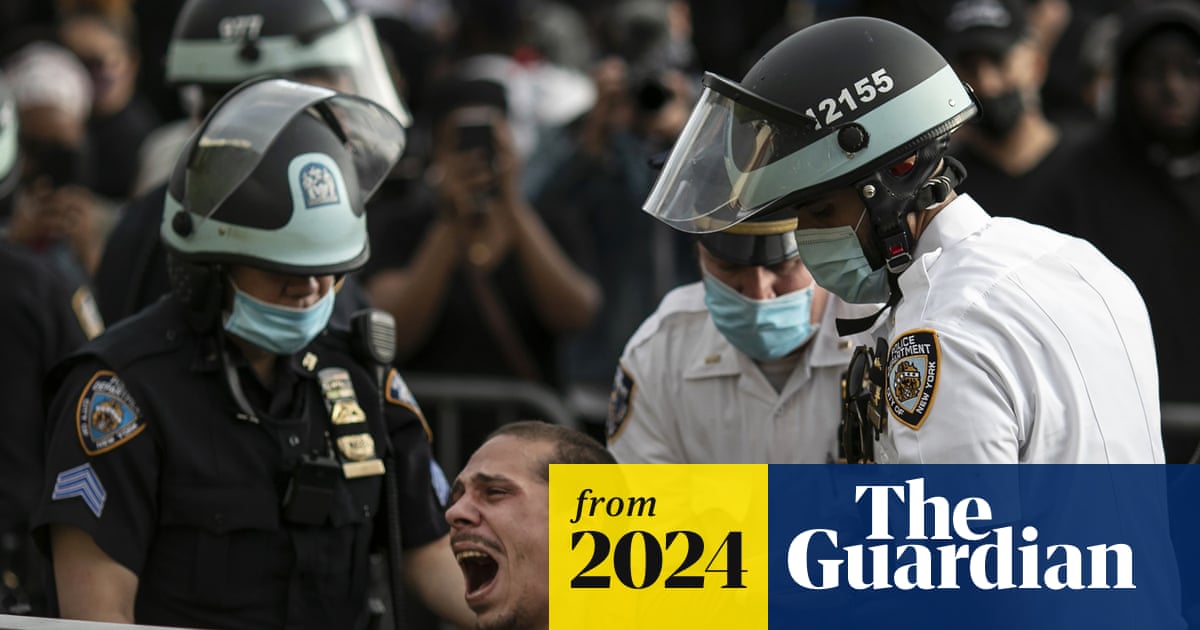
US police use force on 300,000 people a year, with numbers rising since George Floyd: ‘relentless violence’
Exclusive: groundbreaking Mapping Police Violence data estimates scale of physical force and civilian injuries
Journalists and Researchers: How to Examine FBI Crime Data for Your Community
Here’s what to know about NIBRS, the FBI’s program for collecting police data from 15,000 agencies across the U.S.
Police Records - CalMatters
Search California public records about law enforcement violence and misconduct.
A database of 10 years of Boston Police disciplinary action - The Boston Globe
The City of Boston does not provide a comprehensive, transparent system that allows residents to keep tabs on its police. So the Globe decided to create its own searchable database.

The Matrix - The Center for Evidence-Based Crime Policy (CEBCP)
The Evidence-Based Policing Matrix What strategies can be effective in reducing crime and disorder in policing? The Evidence-Based Policing Matrix is a research-to-practice translation tool that collects, summarizes, and organizes moderate to very rigorous evaluations of police interventions, allowing agencies and researchers to view the field of research in this area. The Matrix includes studies…
The Most Violent Police Force in Europe: Police Brutality in France — The World Mind
Contributing Editor Aaron Shires explores the rise in excessive use of force by French police forces and the disparate impact this has on racial minorities in France.

The Henry A. Wallace Police Crime Database
The Police Crime Database includes summary information on 20,711 criminal arrest cases from the years 2005-2021 involving 16,758 individual nonfederal sworn law enforcement officers, each of whom were charged with one or more crimes. The arrested officers were employed by 5,466 state, local, and special law enforcement agencies located in 1,987 counties and independent cities in all 50 states and the District of Columbia.
NYPD Complaint Data Historic | NYC Open Data
Opinion | Surprise! NSA data will soon routinely be used for domestic policing that has nothing to do with terrorism
Another "national security" power evolves into an everyday power.
COMMENTARY: Police are not primarily crime fighters, according to the data
A new report adds to a growing line of research showing that police departments don’t solve serious or violent crimes with any regularity, and in fact, spend very little time on crime control, in contrast to popular narratives.

California Police Are Sharing Facial Recognition Databases to ID Suspects
New emails reveal how a private technology company is working to change law enforcement as we know it

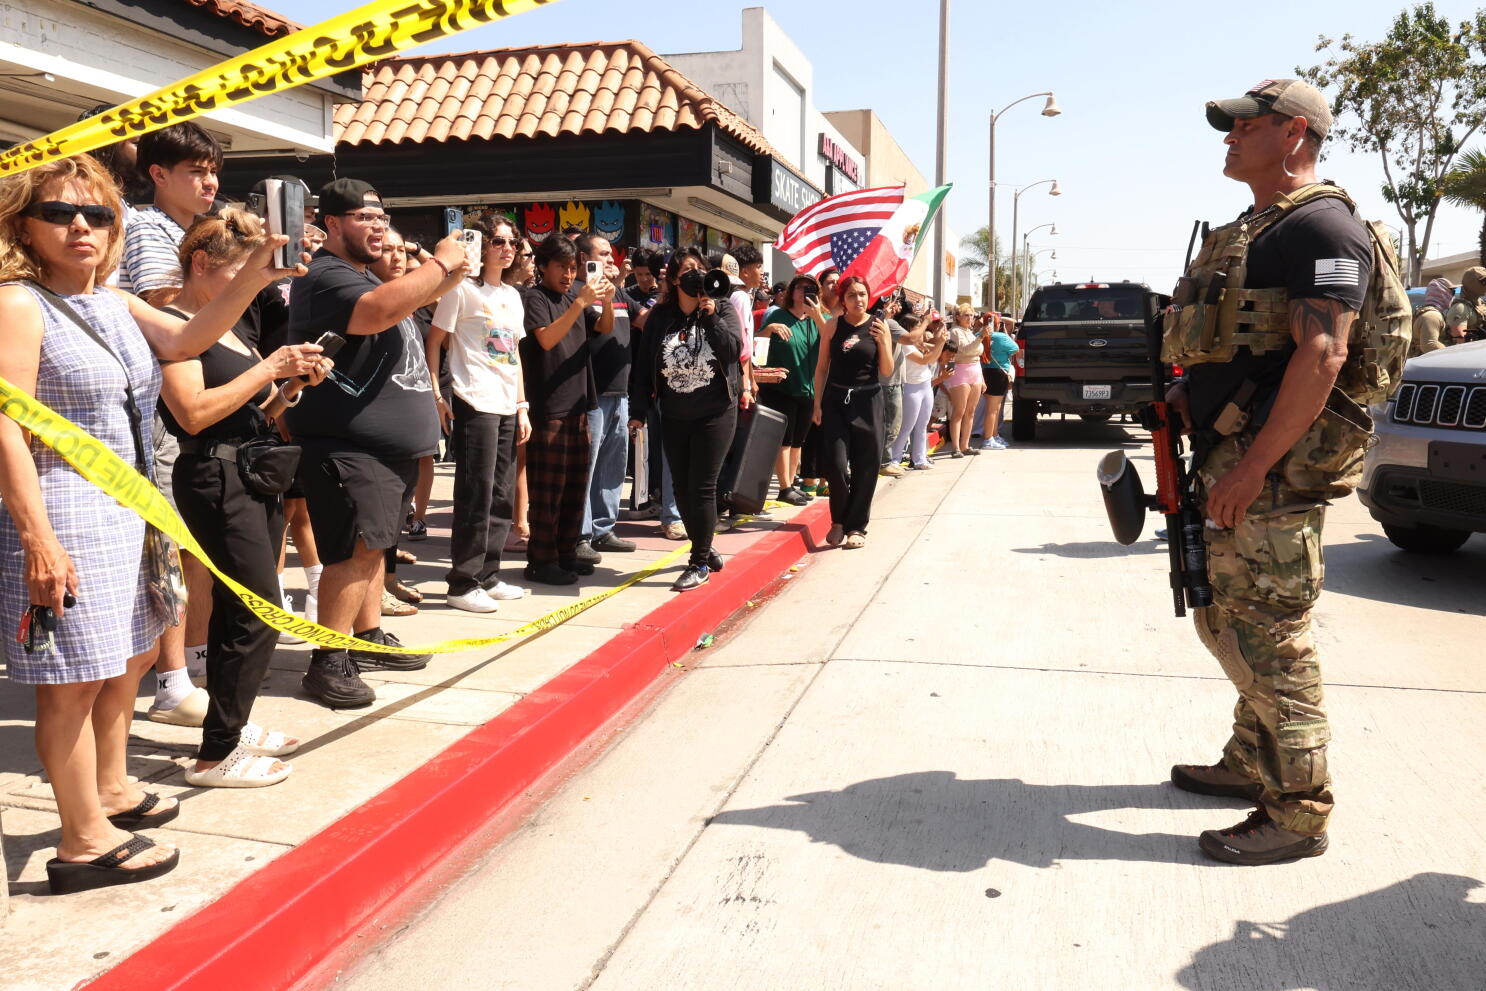
Attacks on ICE up 1,000%? Trump administration claim not backed up by court records
The Trump administration has cited a more than 1,000% increase in assaults on immigration agents to justify aggressive tactics. But court records reviewed by The Times show the majority of the alleged assaults in the areas where ICE and Border Patrol have been most active resulted in no injuries.
Criminal Justice Fact Sheet
A compilation of facts and figures surrounding policing, the criminal justice system, incarceration, and more.

City Snapshots — For The People
Did you know that Las Cruces, New Mexico spends 870 times more on policing than libraries? Our new publication, Budgets Are Values, gives an overview of how 15 public library systems are funded, governed, and used by communities, and highlights the stark and indefensible contrast between funding for

Police spending has ‘no consistent correlation’ with lower crime rates, new Canadian study says
“I think a lot of people simply assume that more money for the police will mean safer communities,” said co-author Akwasi Owusu-Bempah. “We’re demonstrating that that’s not the case.”
When police pull back: Neighborhood‐level effects of de‐policing on violent and property crime, a research note
Abstract Many U.S. cities witnessed both de‐policing and increased crime in 2020, yet whether the former contributed to the latter remains unclear. Indeed, much of what is known about the effects of proactive policing on crime comes from studies that evaluated highly focused interventions atypical of day‐to‐day policing, used cities as the unit of analysis, or could not rule out endogeneity. This study addresses each of these issues, thereby advancing the evidence base concerning the effects of policing on crime. Leveraging two exogenous shocks presented by the onset of the coronavirus 2019 (COVID‐19) pandemic and social unrest after the murder of George Floyd, we evaluated the effects of sudden and sustained reductions in high‐discretion policing on crime at the neighborhood level in Denver, Colorado. Multilevel models accounting for trends in prior police activity, neighborhood structure, seasonality, and population mobility revealed mixed results. On the one hand, large‐scale reductions in stops and drug‐related arrests were associated with significant increases in violent and property crimes, respectively. On the other hand, fewer disorder arrests did not affect crime. These results were not universal across neighborhoods. We discuss the implications of these findings in light of debates concerning the appropriate role of policing in the 21st century.
