Vega-Lite - a high-level grammar for statistical graphics. Vega-Lite provides a higher-level grammar for visual analysis, comparable to ggplot or Tableau, that generates complete Vega specifications. Vega-Lite specifications consist of simple mappings of variables in a data set to visual encoding channels such as x, y, color, and size. These mappings are then translated into detailed visualization specifications in the form of Vega specification language. Vega-Lite produces default values for visualization components (e.g., scales, axes, and legends) in the output Vega specification using a rule-based approach, but users can explicit specify these properties to override default values.
GitHub - observablehq/plot: A concise API for exploratory data visualization implementing a layered grammar of graphics
A concise API for exploratory data visualization implementing a layered grammar of graphics - observablehq/plot
ggtime: A Grammar of Temporal Graphics
Visualizing changes over time is fundamental to learning from the past and anticipating the future. However, temporal semantics can be complicated, and existing visualization tools often struggle to accurately represent these complexities. It is common to use bespoke plot helper functions designed to produce specific graphics, due to the absence of flexible general tools that respect temporal semantics. We address this problem by proposing a grammar of temporal graphics, and an associated software implementation, 'ggtime', that encodes temporal semantics into a declarative grammar for visualizing temporal data. The grammar introduces new composable elements that support visualization across linear, cyclical, quasi-cyclical, and other granularities; standardization of irregular durations; and alignment of time points across different granularities and time zones. It is designed for interoperability with other semantic variables, allowing navigation across the space of visualizations while preserving temporal semantics.

software-mansion/TypeGPU
A modular and open-ended toolkit for WebGPU, with advanced type inference and the ability to write shaders in TypeScript
TanStack Charts
A typed, tree-shakable chart grammar for SVG and Canvas. Compose marks, views, scales, transforms, interactions, and motion with compact primitives or D3-compatible inputs.
Specs 2
Specs 2 is an ecosystem for specs driven component development. Via the plugin, turn a selected Figma component or component set into a compact, complete, schema-valid specification — computed directly from the file, not inferred from a screenshot. From the command line, generate specs from an en...
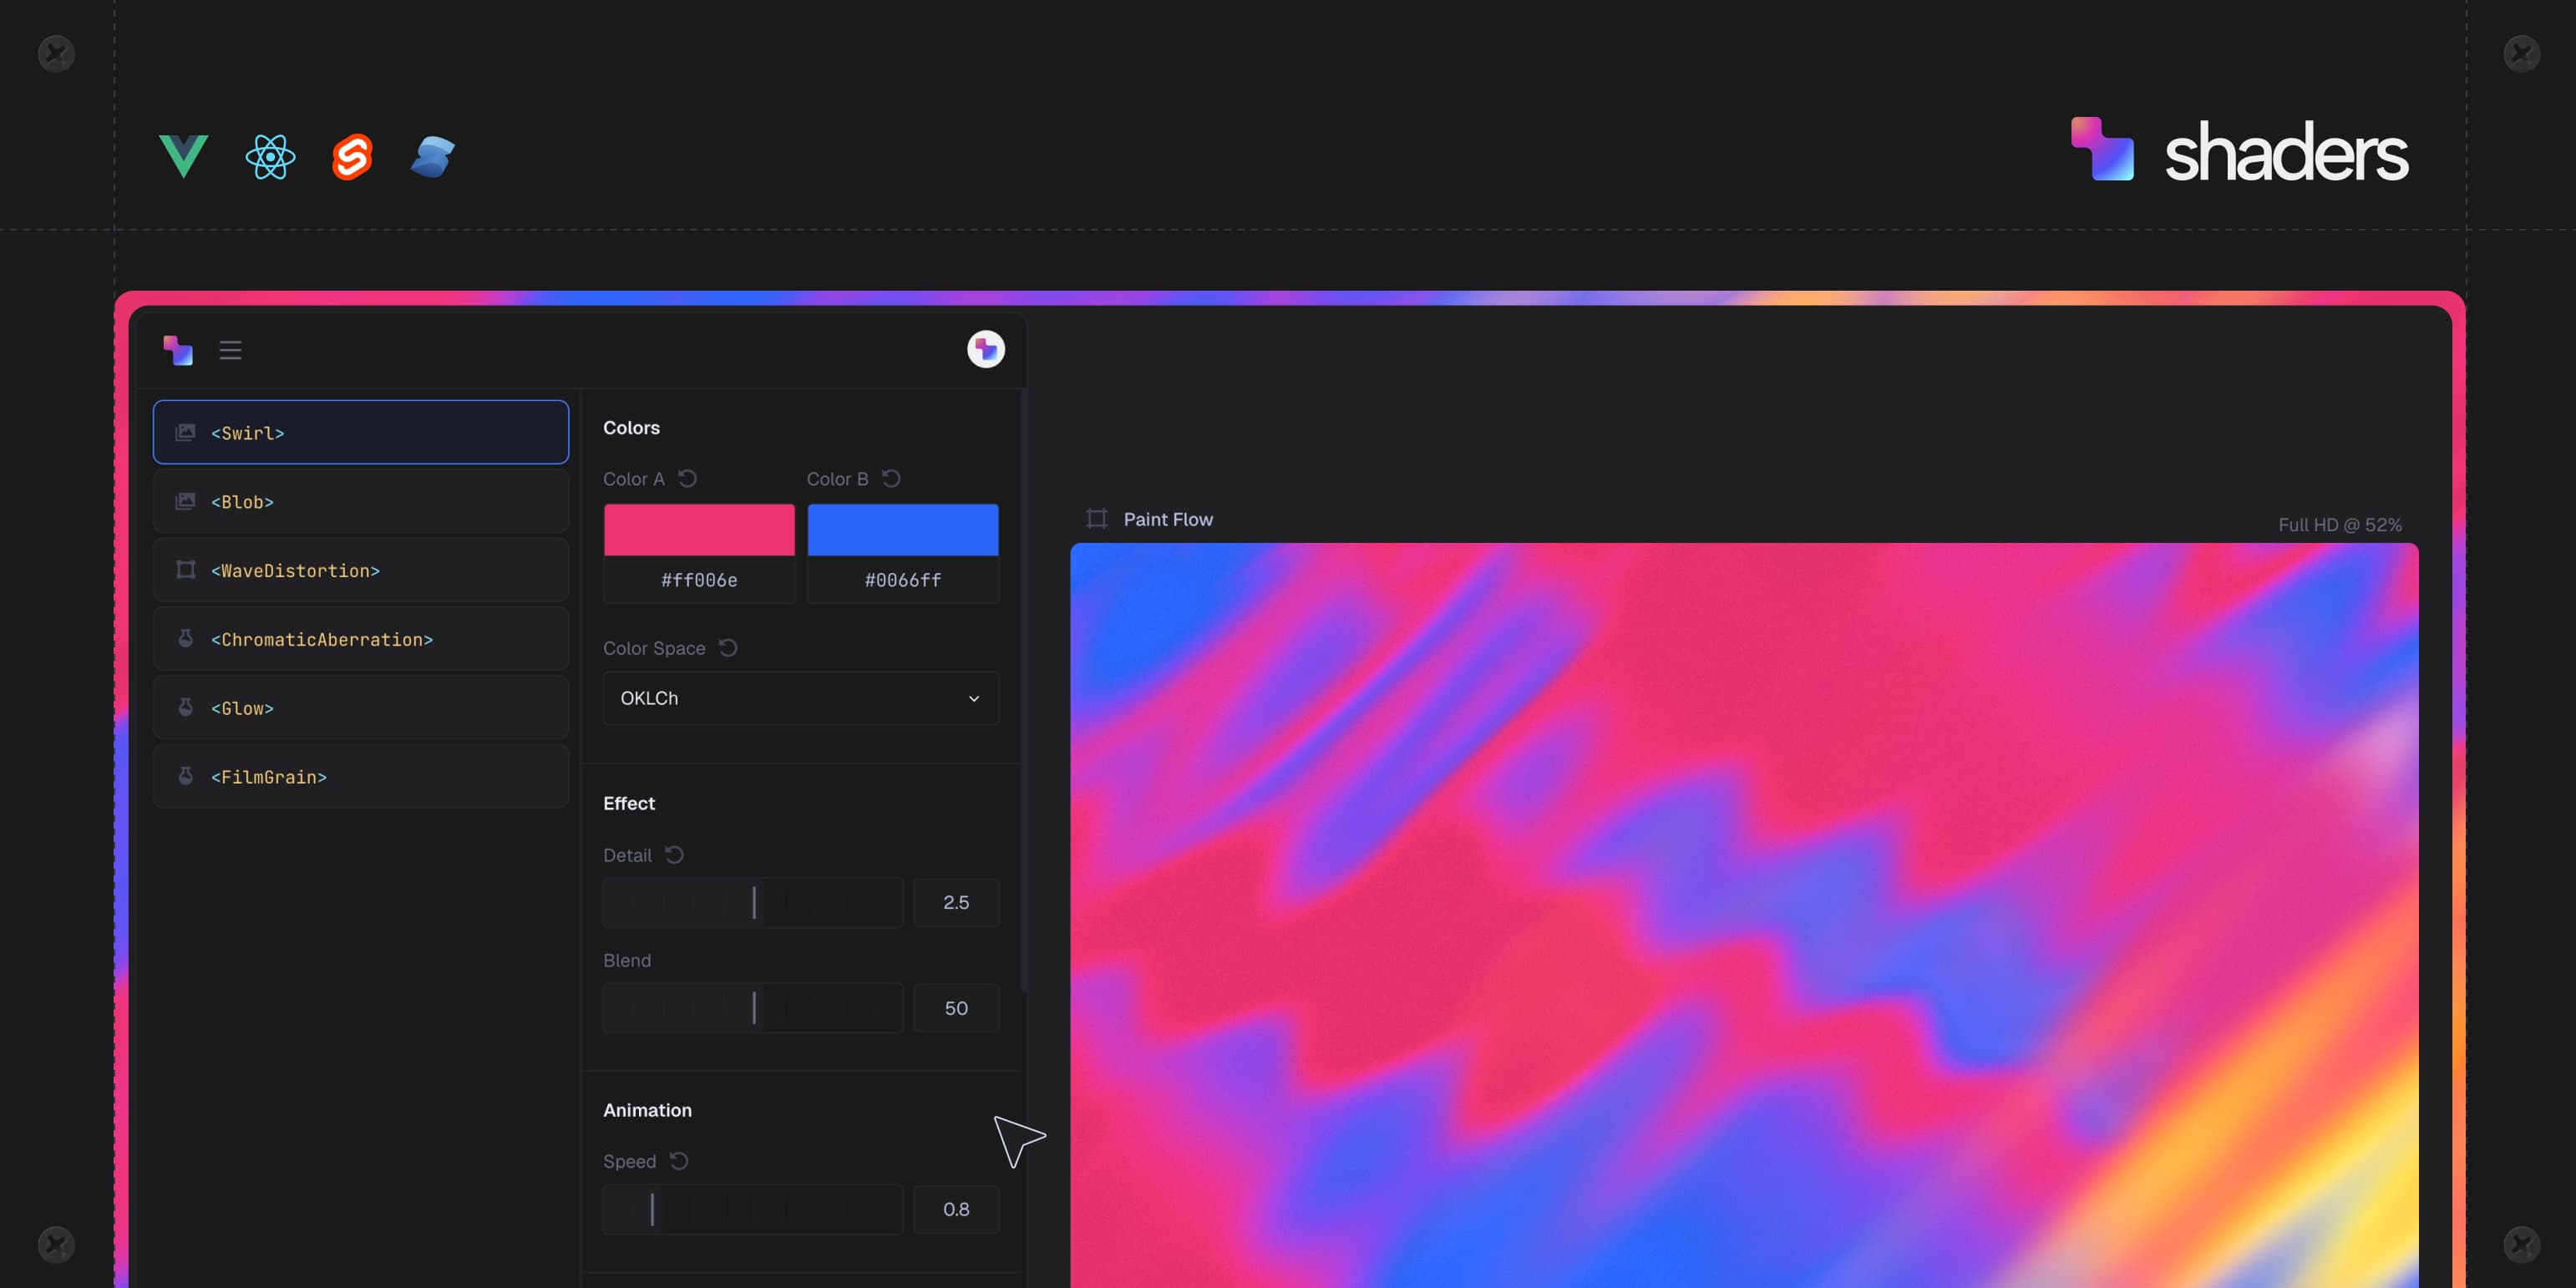
Shaders
Component library for creative WebGPU effects in modern frontend frameworks. Compose interactive visuals for Vue, React, Svelte and Solid.

ggsql: A grammar of graphics for SQL
Introducing ggsql, a grammar of graphics for SQL that lets you describe visualizations directly inside SQL queries.

Tokens Studio for Figma
Gives you the ability to use Design Tokens that can be used for a whole range of design options, from border radii or spacer units to semantic color and typography styles that are able to reference other tokens. It allows you to change tokens and see these changes applied to the whole document, i...
Visual Variables
Visual variables are “the differences in map elements as perceived by the human eye” (wiki.gis.com). No matter what the type of map, these are the fundamental ways in which graphic symbols can be distinguished.
Tangible Functional Programming
Visualizing GL_NV_shader_sm_builtins
Using GL_NV_shader_sm_builtins to visualize Streaming Multiprocessors and Warps
The Slang Shading Language
Empowering real-time graphics developers with advanced language features and machine learning capabilities.
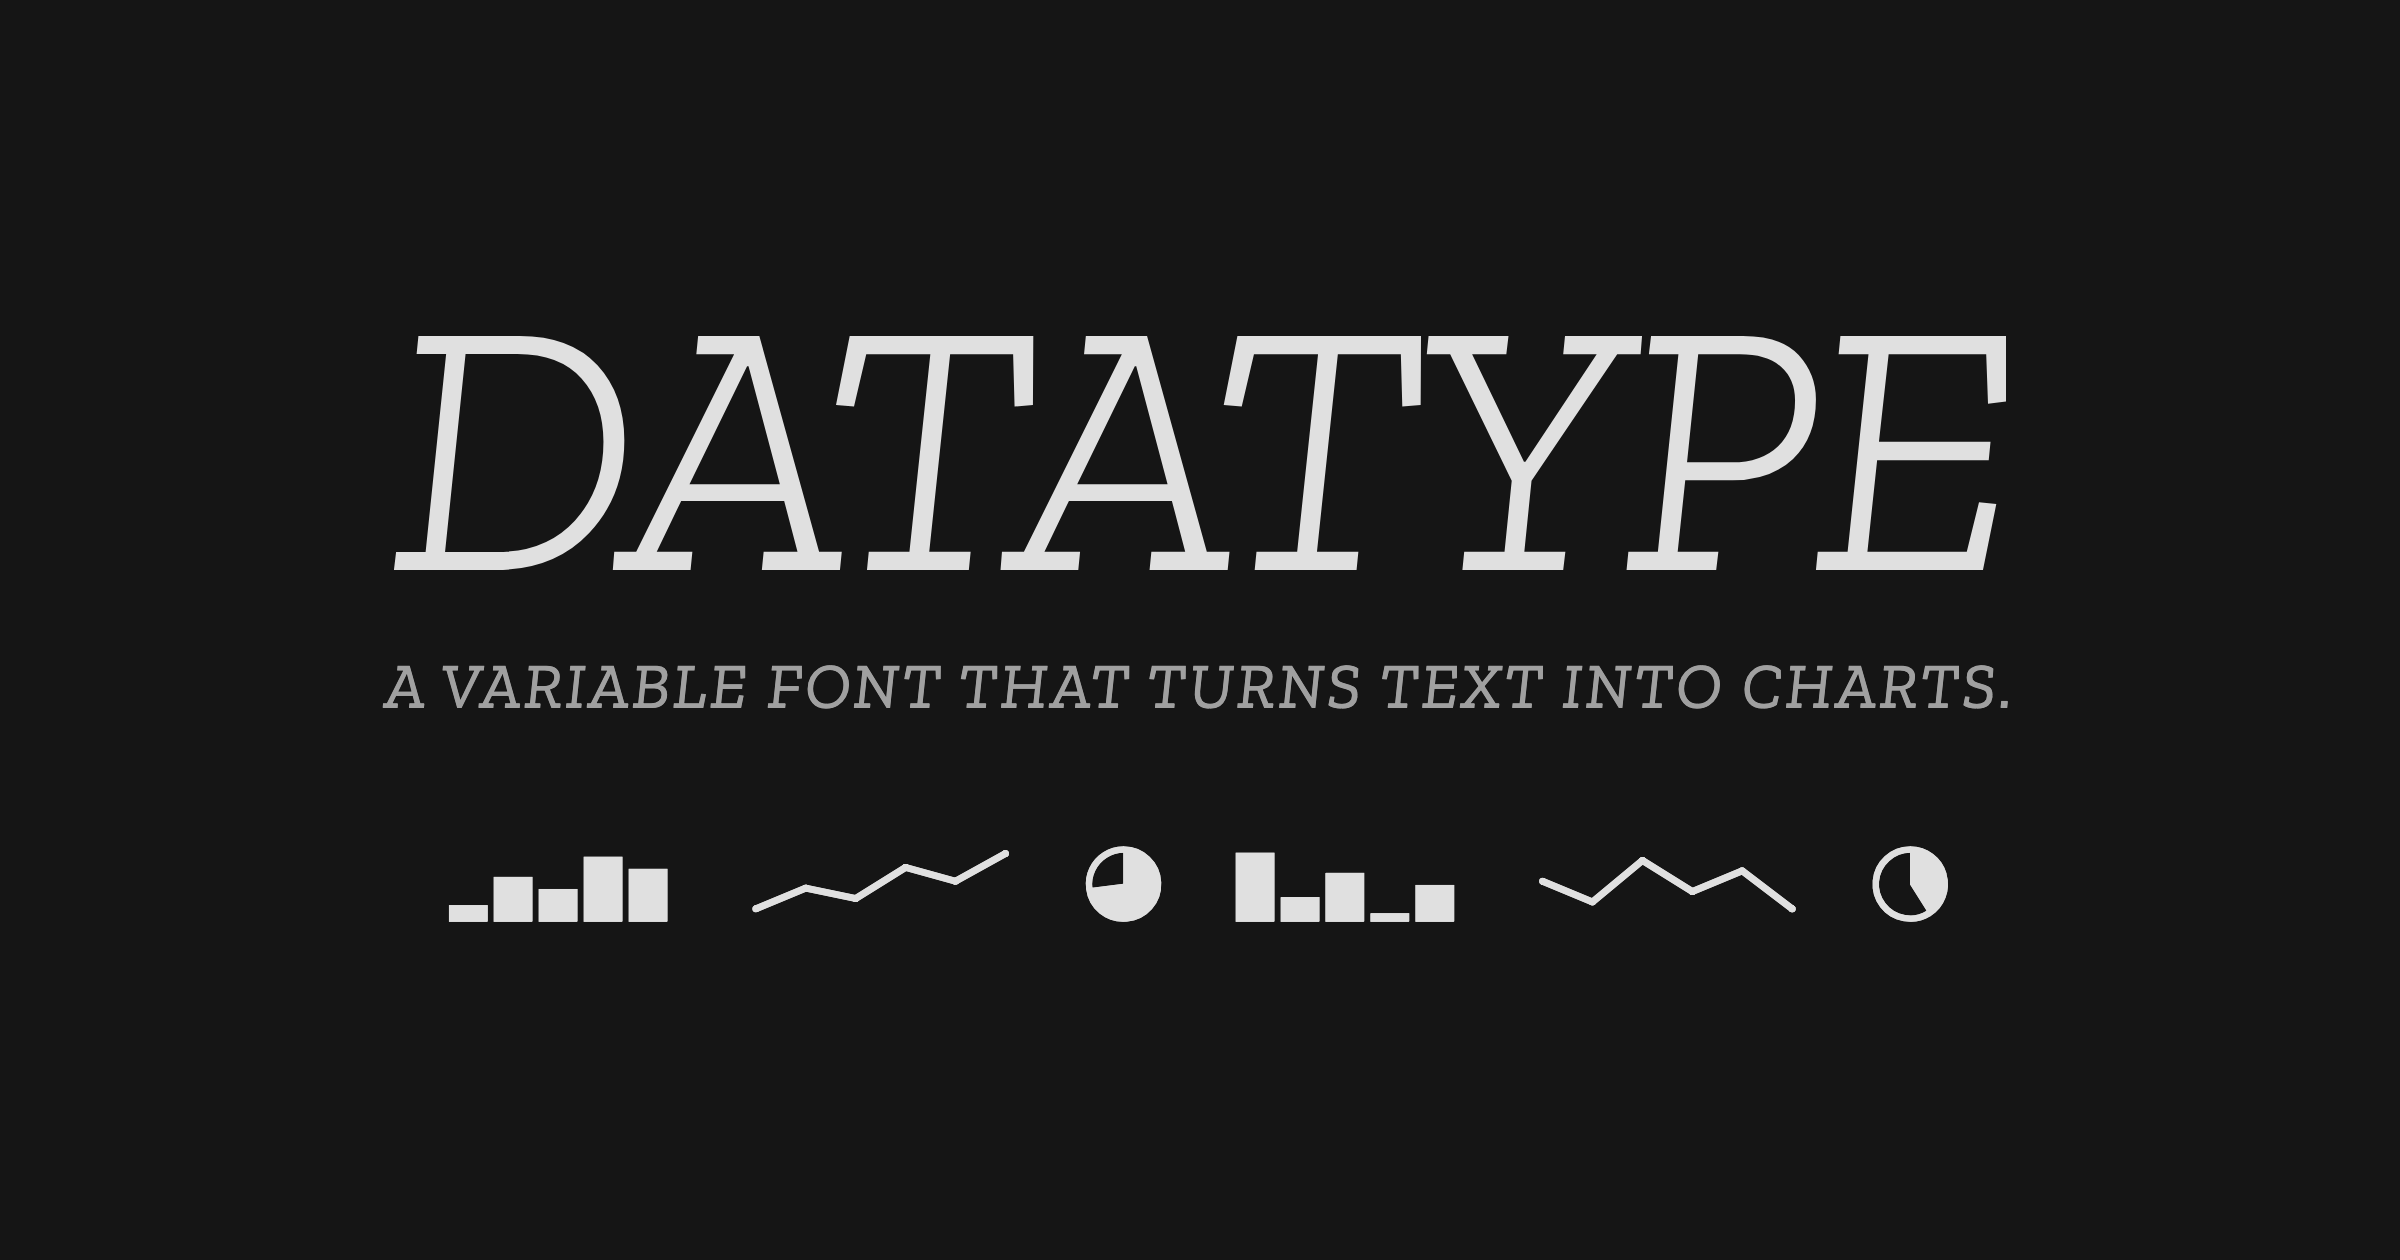
Datatype — variable font that turns text into charts
An OpenType variable font that turns simple text expressions into inline charts. No JavaScript, no images — just type.