

A detailed primer on Roaring bitmaps explaining what they are, how they're different from traditional bitmaps, and how they work internally.
Consistently faster and smaller compressed bitmaps with Roaring | Daniel Lemire, Computer Science Professor
Computer Science Professor
Better bitmap performance with Roaring bitmaps
Bitmap indexes are commonly used in databases and search engines. By exploiting bit-level parallelism, they can significantly accelerate queries. However, they can use much memory, and thus we might prefer compressed bitmap indexes. Following Oracle's lead, bitmaps are often compressed using run-length encoding (RLE). Building on prior work, we introduce the Roaring compressed bitmap format: it uses packed arrays for compression instead of RLE. We compare it to two high-performance RLE-based bitmap encoding techniques: WAH (Word Aligned Hybrid compression scheme) and Concise (Compressed `n' Composable Integer Set). On synthetic and real data, we find that Roaring bitmaps (1) often compress significantly better (e.g., 2 times) and (2) are faster than the compressed alternatives (up to 900 times faster for intersections). Our results challenge the view that RLE-based bitmap compression is best.

An entire Social Network in 1.6GB (GraphD Part 2)
Roaring Bitmaps offer an even more efficient way to store and query an entire social graph, fitting the entire network of 5.5M users and 164M+ follows into a ~1.6GB SQLite DB on disk.
Windsurf Codemaps: Understand Code, Before You Vibe It | Cognition
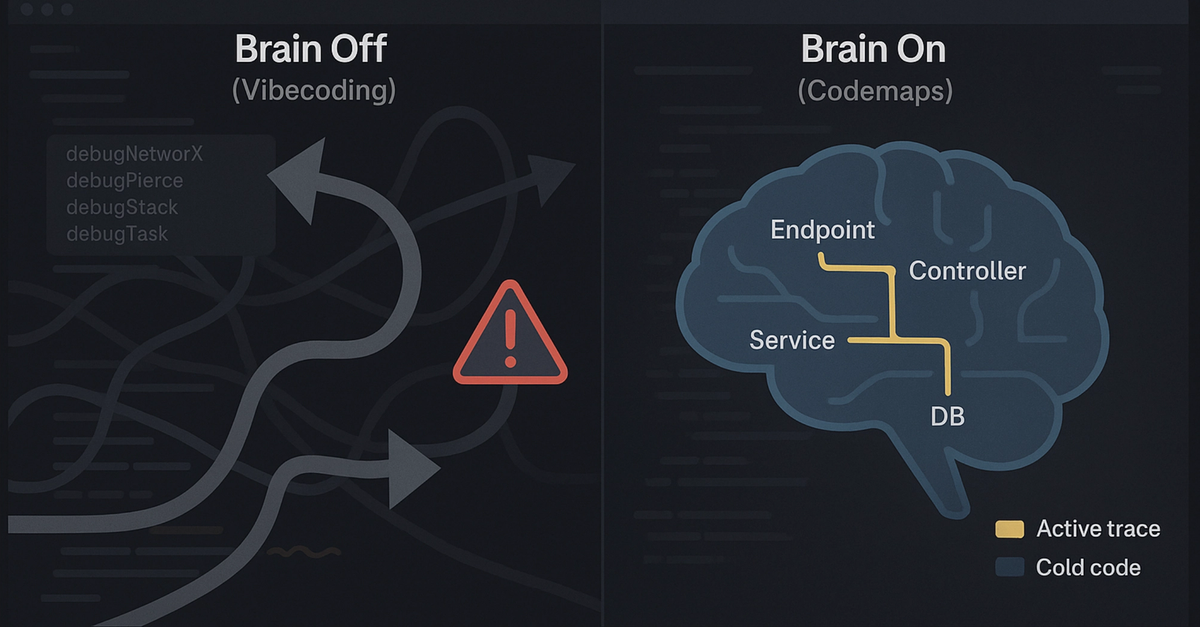
Codemaps is meant to offer a shared understanding of a system between humans and AI, enabling your AI to teach you about the code you are looking at quickly and elegantly. A codemap can be generated about any system or snippet to illuminate its code paths, helping users learn and recall. Codemaps allows AI to be a partner that explains code in an accurate and consistent way, rather than generating tons of inscrutable slop.

GitHub - observablehq/plot: A concise API for exploratory data visualization implementing a layered grammar of graphics
A concise API for exploratory data visualization implementing a layered grammar of graphics - observablehq/plot
The poster to accompany Designing Data-Intensive Applications (DDIA)
Each chapter in Designing Data-Intensive Applications is accompanied by a map. And we’ve turned those maps into a beautiful poster.
COLMAP Online · Feature Detection
A fully local browser workflow for COLMAP and Gaussian Splatting.
visualising data structures and algorithms through animation - VisuAlgo
VisuAlgo was conceptualised in 2011 by Associate Professor Steven Halim (NUS School of Computing) as a tool to help his students better understand data structures and algorithms, by allowing them to learn the basics on their own and at their own pace. Together with his students from the National University of Singapore, a series of visualizations were developed and consolidated, from simple sorting algorithms to complex graph data structures. Though specifically designed for the use of NUS students taking various data structure and algorithm classes (CS1010/equivalent, CS2040/equivalent (inclusive of IT5003)), CS3230, CS3233, and CS4234), as advocators of online learning, we hope that curious minds around the world will find these visualizations useful as well.
chokepoint6
Discover, analyze and download data from chokepoint6. Download in CSV, KML, Zip, GeoJSON, GeoTIFF or PNG. Find API links for GeoServices, WMS, and WFS. Analyze with charts and thematic maps. Take the next step and create StoryMaps and Web Maps.

Bluesky Map
Interactive map of 3.4 million Bluesky users, visualised by their follower pattern.
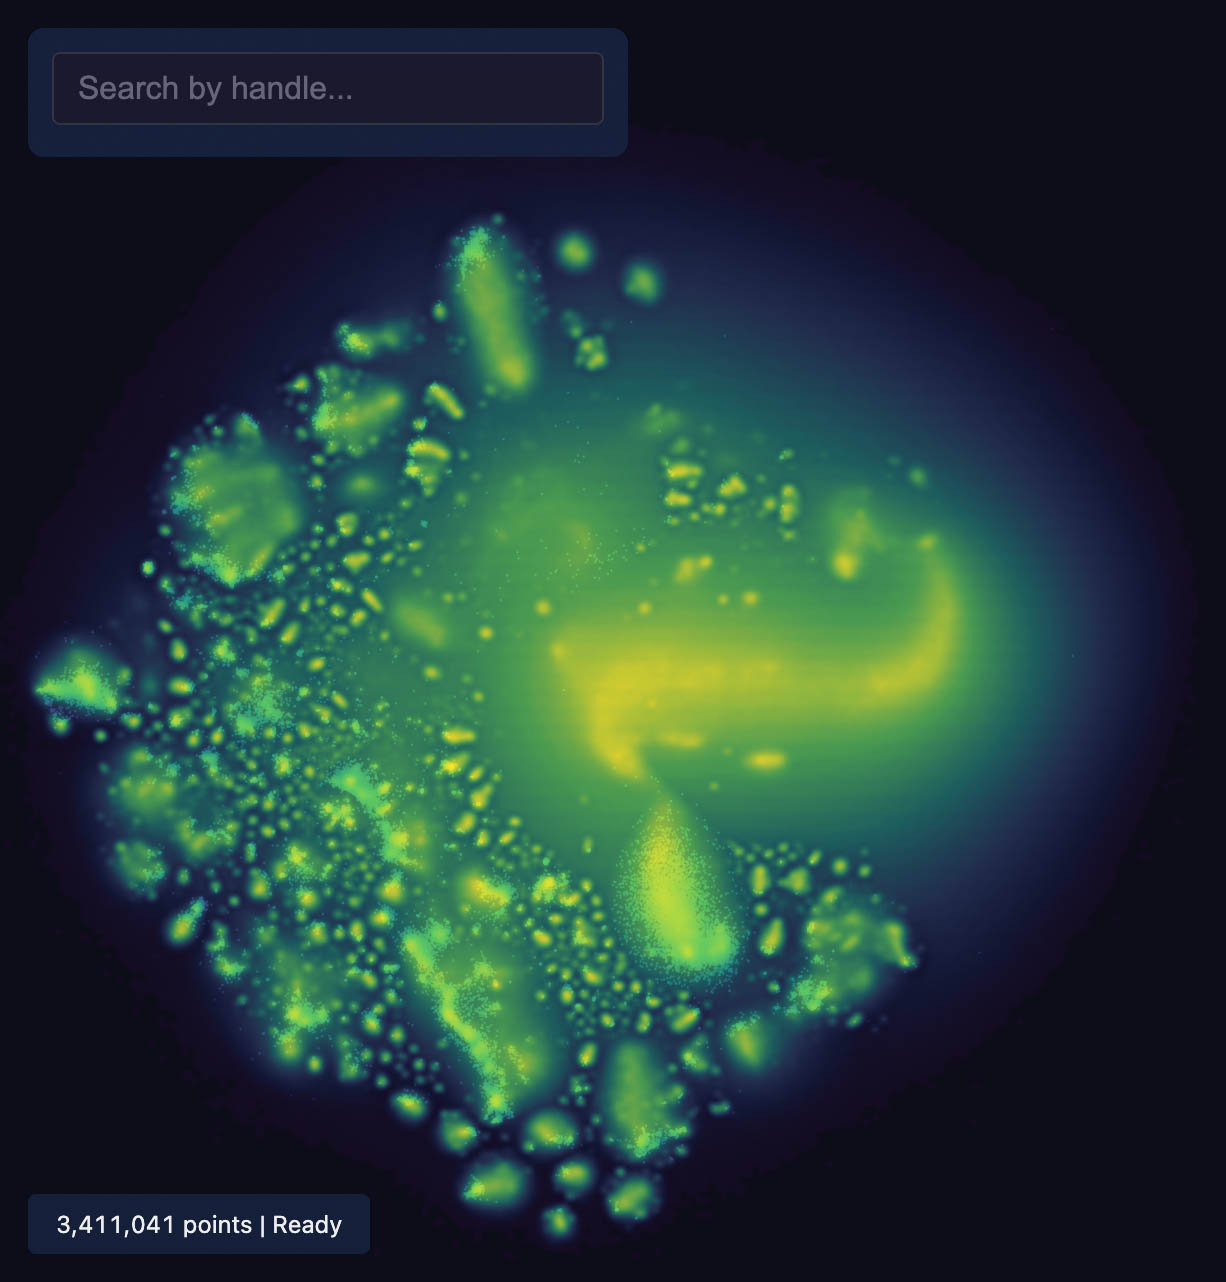
Bluesky Map
Interactive map of 3 million Bluesky users, visualised by their follower pattern.
mudcoders/awesome-mud
🖥 A curated list of bookmarks, tools, tutorials, and other cool resources for text-based game developers.
Grain photos in Micro.blog: manton.org/2026/07/23/grain-photos-in-mi…

