

VisuAlgo was conceptualised in 2011 by Associate Professor Steven Halim (NUS School of Computing) as a tool to help his students better understand data structures and algorithms, by allowing them to learn the basics on their own and at their own pace. Together with his students from the National University of Singapore, a series of visualizations were developed and consolidated, from simple sorting algorithms to complex graph data structures. Though specifically designed for the use of NUS students taking various data structure and algorithm classes (CS1010/equivalent, CS2040/equivalent (inclusive of IT5003)), CS3230, CS3233, and CS4234), as advocators of online learning, we hope that curious minds around the world will find these visualizations useful as well.
On power, aesthetics, materiality and change in data visualization
Notes from the Information+ Conference at MIT/Northeastern University, Boston.
Drinking from the Firehose: Learning Computer Graphics Techniques and Programming
Graphics researchers waiting in the water fountain line at SIGGRAPH Yellowstone. Computer graphics as a field is broad, deep, complex, and intimidating. More than half a century of rapid progress driven by academic research and industry practices underly it. Parts delve pretty far into physics, math, signal processing, systems programming (and more). And performance is always at a premium—so simple, straightforward techniques are often not possible, and high-level programming abstractions not usable.

The 34th International Symposium on Graph Drawing and Network Visualization
The 34th International Symposium on Graph Drawing and Network Visualization will be held at Brock University in St. Catharines, Ontario, Canada from August 17-21, 2026. A PhD school will take place on August 17-18, 2026.
Prof. Judy Fan: Cognitive Tools for Making the Invisible Visible
Prof. Judy Fan: Cognitive Tools for Making the Invisible Visible
Sigma.js
a JavaScript library aimed at visualizing graphs of thousands of nodes and edges
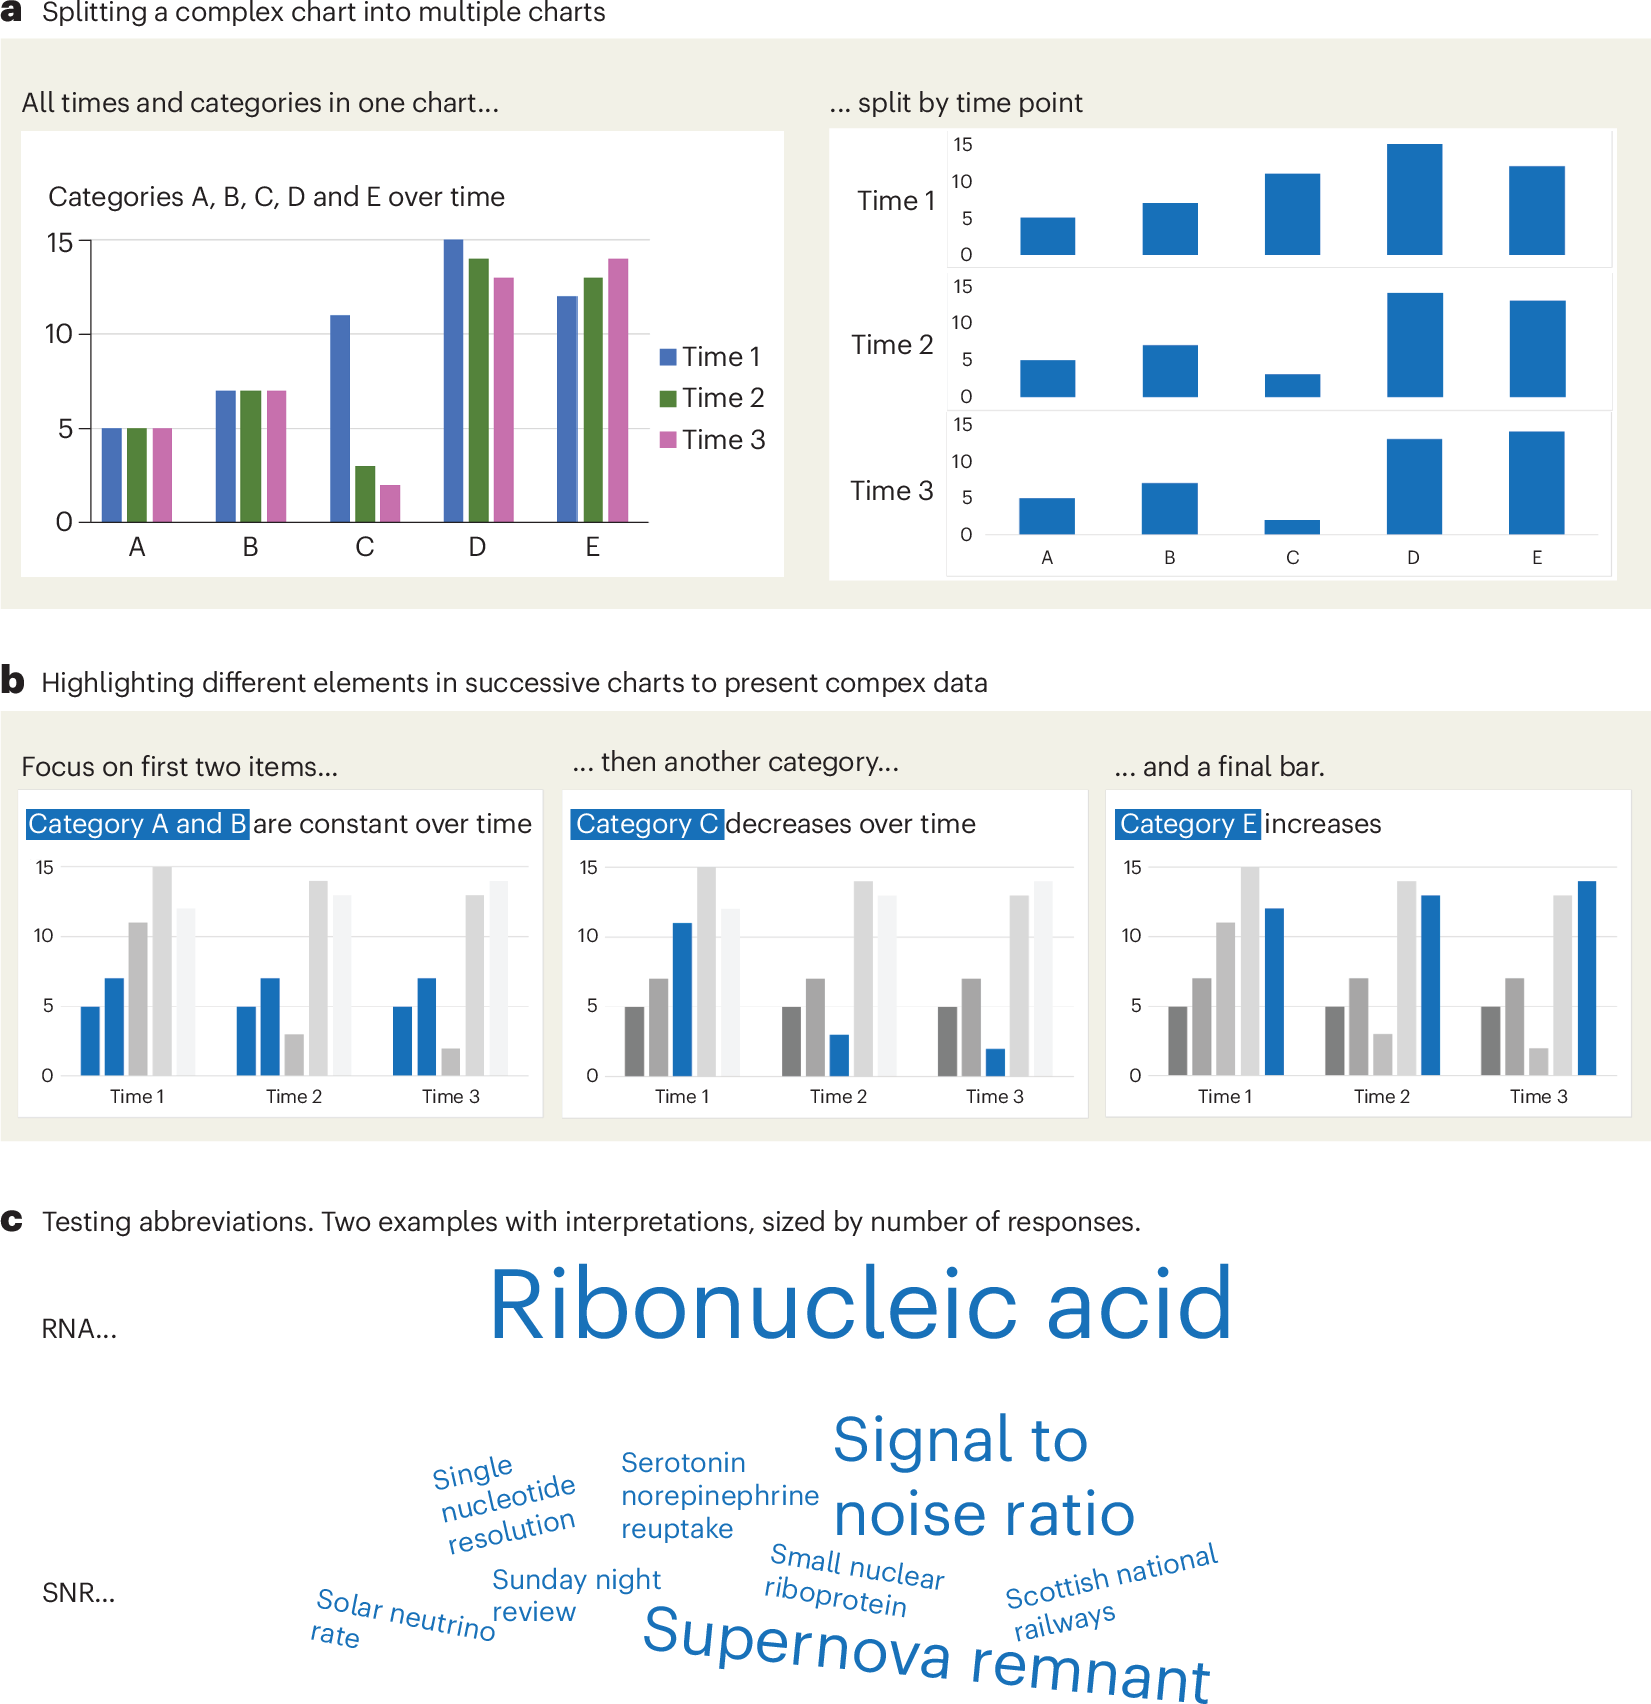
A checklist for designing and improving the visualization of scientific data
Creating clear and engaging scientific figures is crucial to communicate complex data. In this Comment, I condense principles from design, visual perception and data visualization research in a checklist that can help researchers to improve their data visualization, by focusing on clarity, accessibility and design best practices.
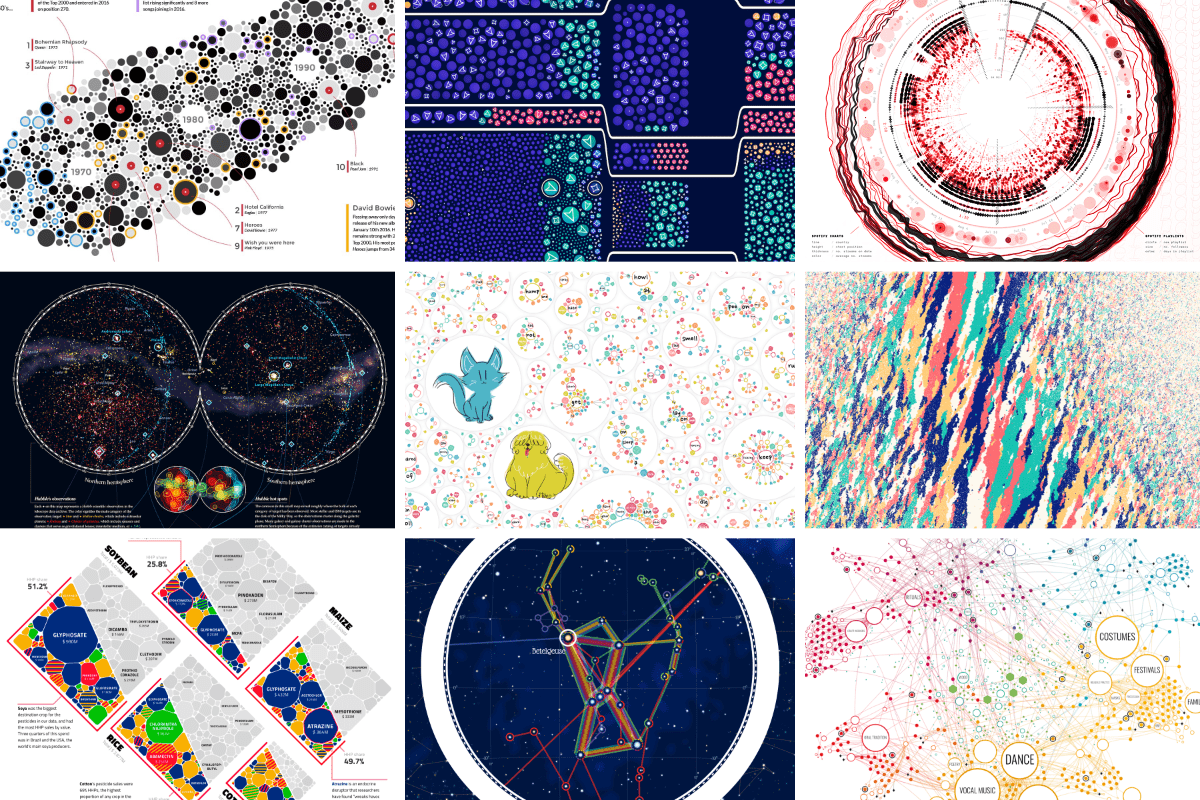
An Award-winning Data Visualization Designer
Visual Cinnamon | Data Visualization Design & Data Art | Data made insightful, effective & beautiful through data visualization and data art
GitHub - observablehq/plot: A concise API for exploratory data visualization implementing a layered grammar of graphics
A concise API for exploratory data visualization implementing a layered grammar of graphics - observablehq/plot
GitHub - HEmile/juggl: An interactive, stylable and expandable graph view for Obsidian. Juggl is designed as an advanced 'local' graph view, where you can juggle all your thoughts with ease.
An interactive, stylable and expandable graph view for Obsidian. Juggl is designed as an advanced 'local' graph view, where you can juggle all your thoughts with ease. - GitHub - H...
On Software, or the Persistence of Visual Knowledge
Wendy Hui Kyong Chun; On Software, or the Persistence of Visual Knowledge. Grey Room 2005; (18): 26–51. doi: https://doi.org/10.1162/1526381043320741
Cosmograph: Beautiful Visualization and Analytics | Cosmograph
Beautiful Visualization and Analytics

Svelte - Data Visualization

MIERUNE/svelte-maplibre-gl
Rich-Harris/pancake
www.npmjs.com
Unovis
Layer Cake

TanStack Table