


Preface to First Edition Before writing the graphics for SYSTAT in the 1980’s, I began by teaching a seminar in statistical graphics and collecting as many different quantitative graphics as I could find. I was determined to produce a package that could draw every statistical graphic I had ever seen. The structure of the program was a collection of procedures named after the basic graph types they p- duced. The graphics code was roughly one and a half megabytes in size. In the early 1990’s, I redesigned the SYSTAT graphics package using - ject-based technology. I intended to produce a more comprehensive and - namic package. I accomplished this by embedding graphical elements in a tree structure. Rendering graphics was done by walking the tree and editing worked by adding and deleting nodes. The code size fell to under a megabyte. In the late 1990’s, I collaborated with Dan Rope at the Bureau of Labor Statistics and Dan Carr at George Mason University to produce a graphics p- duction library called GPL, this time in Java. Our goal was to develop graphics components. This book was nourished by that project. So far, the GPL code size is under half a megabyte.
Create Elegant Data Visualisations Using the Grammar of Graphics
A system for declaratively creating graphics, based on "The Grammar of Graphics". You provide the data, tell ggplot2 how to map variables to aesthetics, what graphical primitives to use, and it takes care of the details.
Drinking from the Firehose: Learning Computer Graphics Techniques and Programming
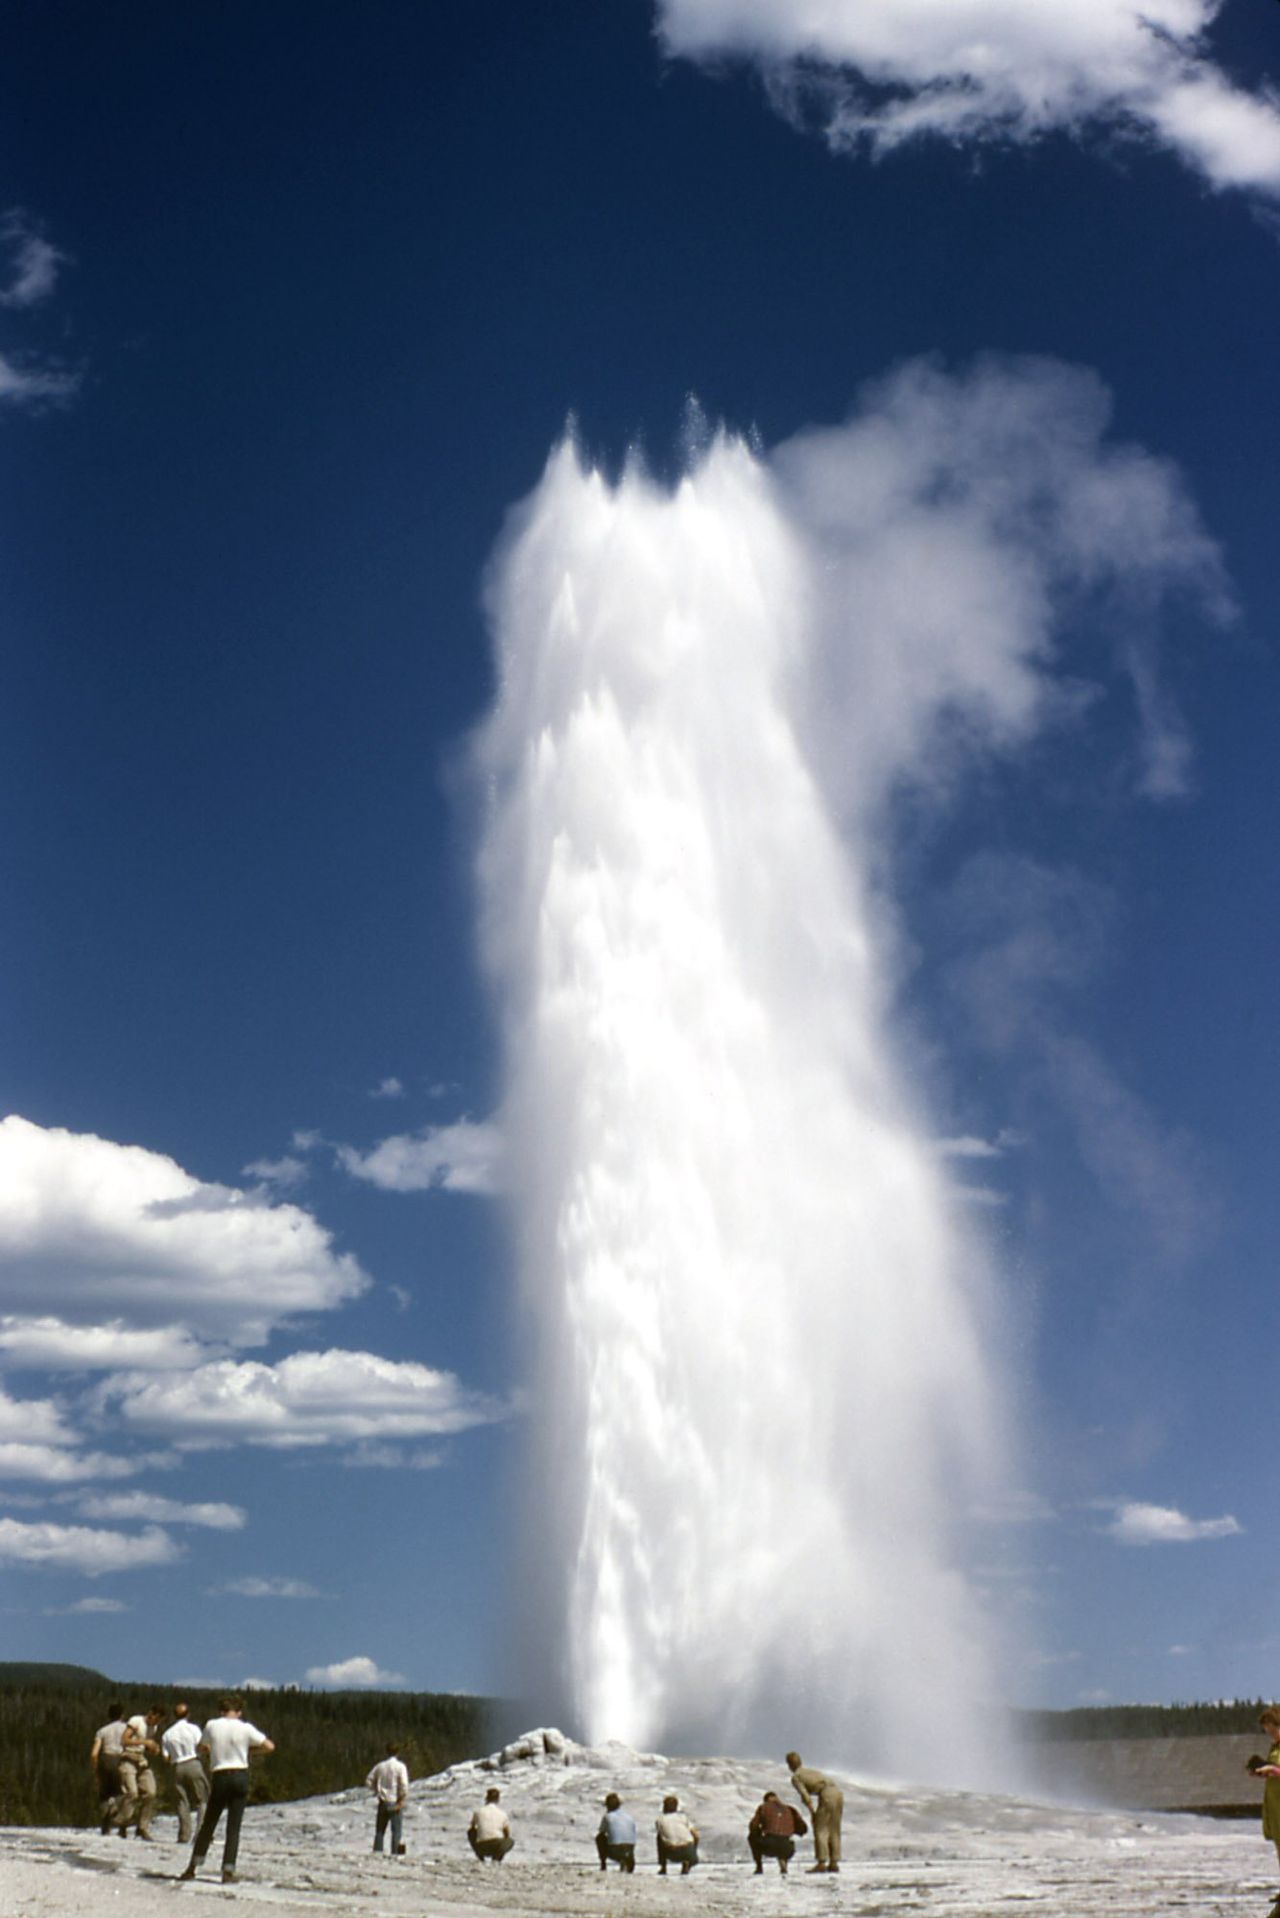
Graphics researchers waiting in the water fountain line at SIGGRAPH Yellowstone. Computer graphics as a field is broad, deep, complex, and intimidating. More than half a century of rapid progress driven by academic research and industry practices underly it. Parts delve pretty far into physics, math, signal processing, systems programming (and more). And performance is always at a premium—so simple, straightforward techniques are often not possible, and high-level programming abstractions not usable.
A High-Level Grammar of Interactive Graphics
Vega-Lite - a high-level grammar for statistical graphics. Vega-Lite provides a higher-level grammar for visual analysis, comparable to ggplot or Tableau, that generates complete Vega specifications. Vega-Lite specifications consist of simple mappings of variables in a data set to visual encoding channels such as x, y, color, and size. These mappings are then translated into detailed visualization specifications in the form of Vega specification language. Vega-Lite produces default values for visualization components (e.g., scales, axes, and legends) in the output Vega specification using a rule-based approach, but users can explicit specify these properties to override default values.
Home · Gadfly.jl
Gadfly is a system for plotting and visualization written in Julia. It is based largely on Hadley Wickhams's ggplot2 for R and Leland Wilkinson's book The Grammar of Graphics. It was Daniel C. Jones' brainchild and is now maintained by the community. Please consider citing it if you use it in your work.
ggsql: A grammar of graphics for SQL
Introducing ggsql, a grammar of graphics for SQL that lets you describe visualizations directly inside SQL queries.

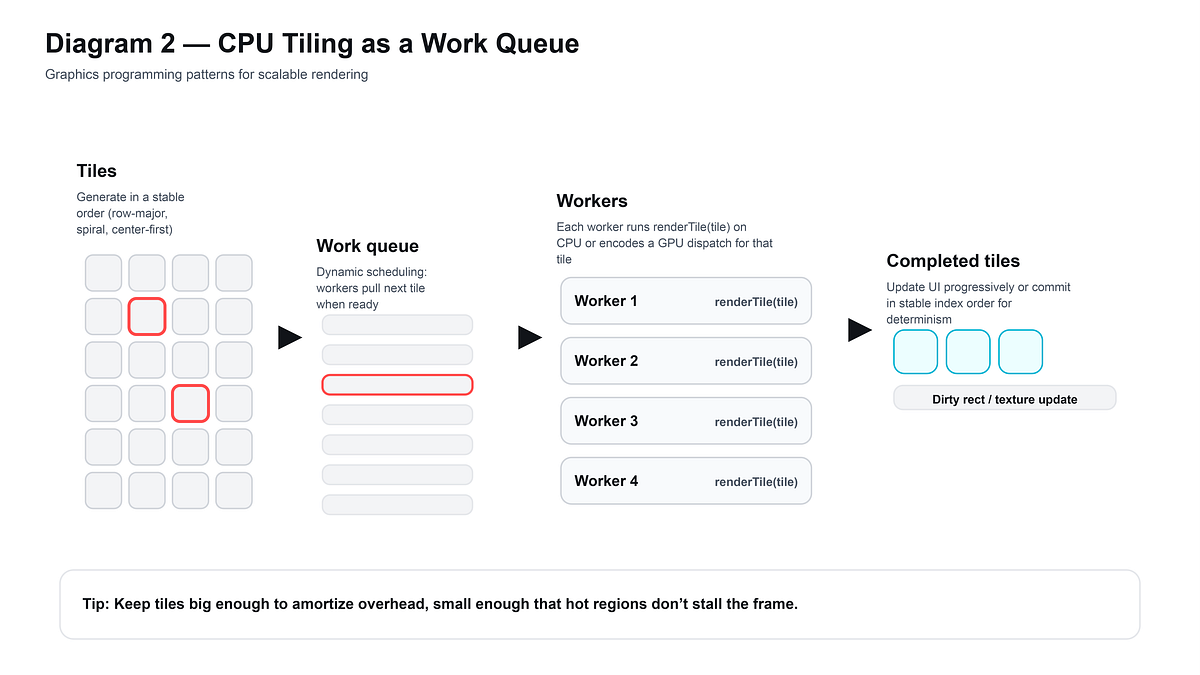
Tiling Is the Missing Abstraction in Graphics Programming
A software engineer’s playbook for tiling: scheduling, threadgroups, and the small decisions that make performance predictable.
Alex Tardif: Graphics Programmer
visualising data structures and algorithms through animation - VisuAlgo
VisuAlgo was conceptualised in 2011 by Associate Professor Steven Halim (NUS School of Computing) as a tool to help his students better understand data structures and algorithms, by allowing them to learn the basics on their own and at their own pace. Together with his students from the National University of Singapore, a series of visualizations were developed and consolidated, from simple sorting algorithms to complex graph data structures. Though specifically designed for the use of NUS students taking various data structure and algorithm classes (CS1010/equivalent, CS2040/equivalent (inclusive of IT5003)), CS3230, CS3233, and CS4234), as advocators of online learning, we hope that curious minds around the world will find these visualizations useful as well.
GitHub - observablehq/plot: A concise API for exploratory data visualization implementing a layered grammar of graphics
A concise API for exploratory data visualization implementing a layered grammar of graphics - observablehq/plot
Nomnoml
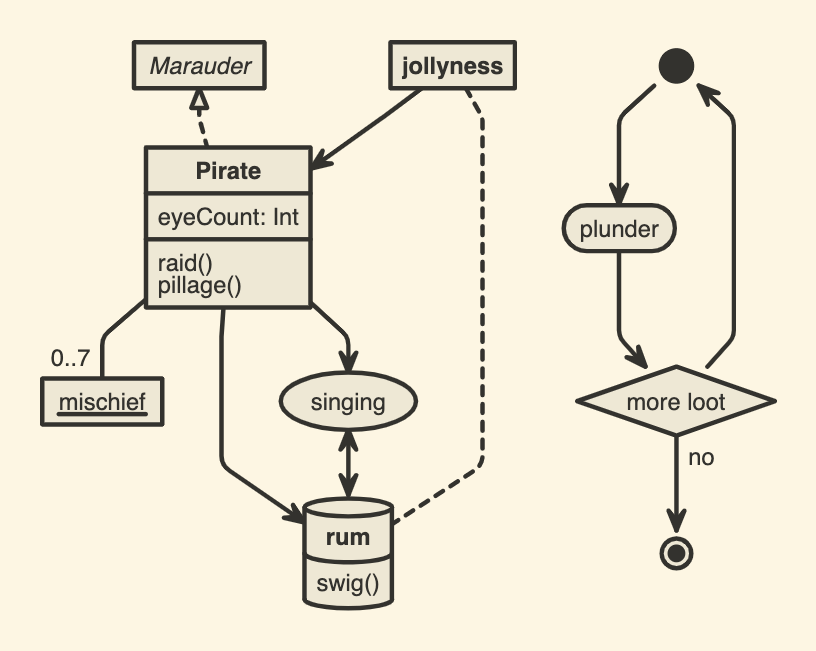
A tool for drawing diagrams based on syntax. Supercharge your boxes and arrows.
ggtime: A Grammar of Temporal Graphics
Visualizing changes over time is fundamental to learning from the past and anticipating the future. However, temporal semantics can be complicated, and existing visualization tools often struggle to accurately represent these complexities. It is common to use bespoke plot helper functions designed to produce specific graphics, due to the absence of flexible general tools that respect temporal semantics. We address this problem by proposing a grammar of temporal graphics, and an associated software implementation, 'ggtime', that encodes temporal semantics into a declarative grammar for visualizing temporal data. The grammar introduces new composable elements that support visualization across linear, cyclical, quasi-cyclical, and other granularities; standardization of irregular durations; and alignment of time points across different granularities and time zones. It is designed for interoperability with other semantic variables, allowing navigation across the space of visualizations while preserving temporal semantics.

paint: a timeline — Kristen Roos
This timeline is the result of researching the origins of digital paint and draw software, and the tools that were developed to allow for hand manipulation (versus plotter drawn) drawing and painting - the mouse, light pen & drawing tablet. If we look at the software that has become commonplace today (such as adobe photoshop), which allows for painting, animation and photo manipulation in one, we can trace the roots of this software to the University and Corporate Labs that housed large computers with advanced capabilities for their time - MIT Lincoln Labs & Radiation Labs, DARPA & the Augmented Research Centre (ARC), Bell Labs, NYIT’s Computer Graphics Lab, Xerox Palo Alto Research Centre (Xerox PARC), NASA’s Jet Propulsion Labs (JPL). The artistic collaborations that grew out of these labs fueled the advent of Computer Graphics, Computer Art and Video Art from the 1960's to the 1990's.
Tangible Functional Programming
Category Theory Illustrated - index
What does a debate between two ancient Greek philosophers have to do with the code running your computer? How can a simple map reveal the deepest secrets of the universe’s structure?