Visual variables are “the differences in map elements as perceived by the human eye” (wiki.gis.com). No matter what the type of map, these are the fundamental ways in which graphic symbols can be distinguished.
Visual language
A visual language is a system of communication using visual elements. Speech as a means of communication cannot strictly be separated from the whole of human communicative activity which includes the visual and the term 'language' in relation to vision is an extension of its use to describe the perception, comprehension and production of visible signs.

A High-Level Grammar of Interactive Graphics
Vega-Lite - a high-level grammar for statistical graphics. Vega-Lite provides a higher-level grammar for visual analysis, comparable to ggplot or Tableau, that generates complete Vega specifications. Vega-Lite specifications consist of simple mappings of variables in a data set to visual encoding channels such as x, y, color, and size. These mappings are then translated into detailed visualization specifications in the form of Vega specification language. Vega-Lite produces default values for visualization components (e.g., scales, axes, and legends) in the output Vega specification using a rule-based approach, but users can explicit specify these properties to override default values.
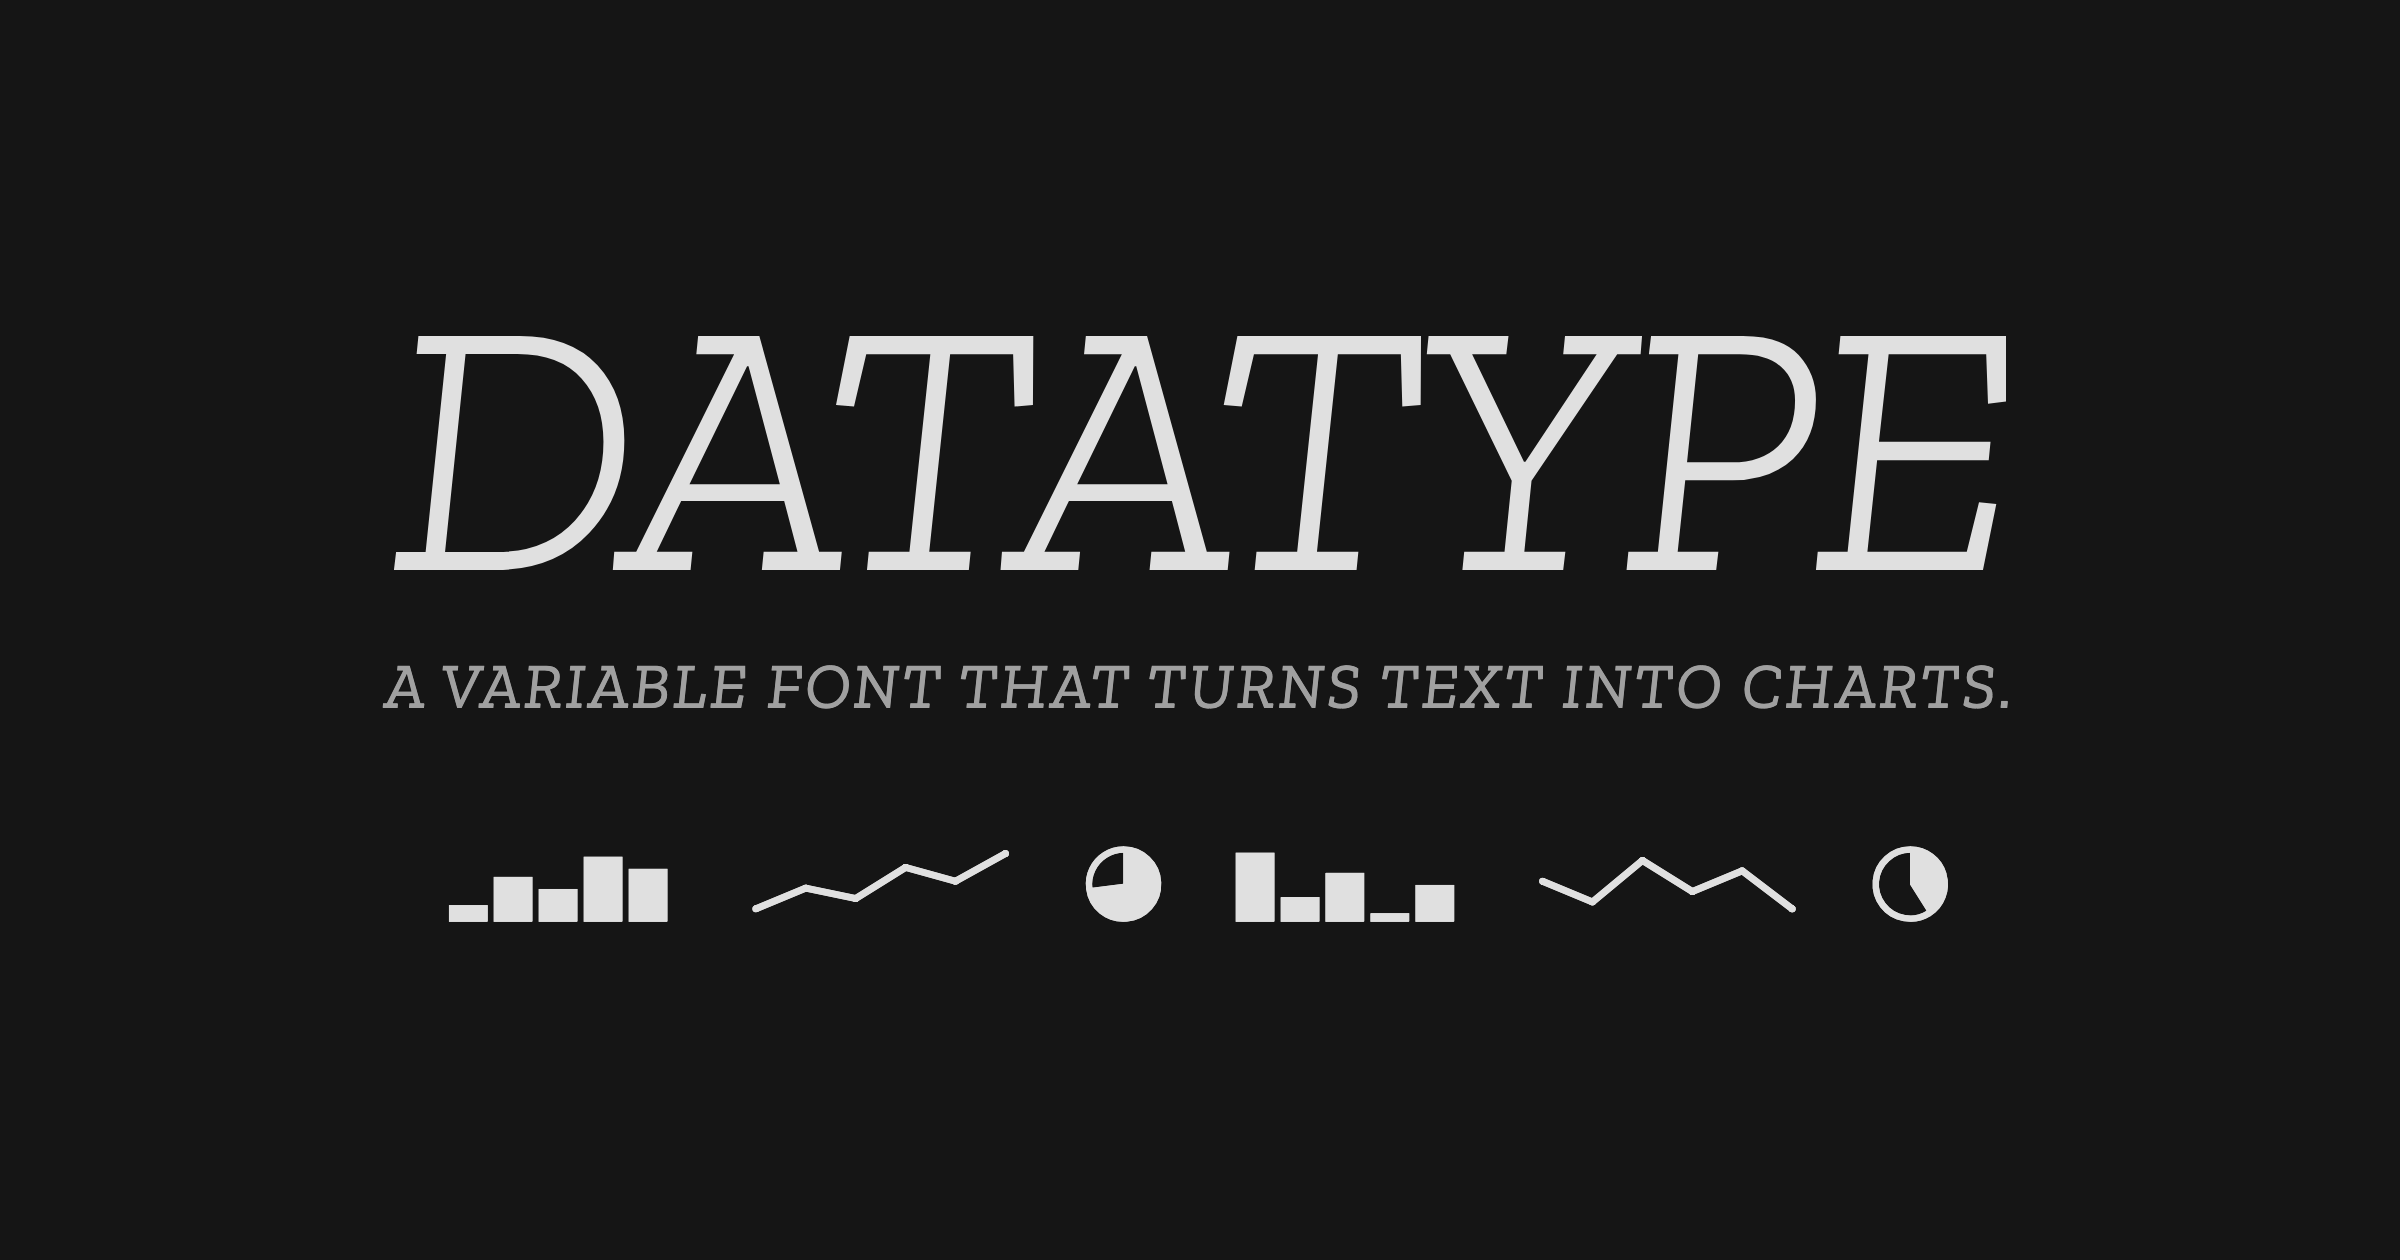
Datatype — variable font that turns text into charts
An OpenType variable font that turns simple text expressions into inline charts. No JavaScript, no images — just type.
Prof. Judy Fan: Cognitive Tools for Making the Invisible Visible
Prof. Judy Fan: Cognitive Tools for Making the Invisible Visible
On Software, or the Persistence of Visual Knowledge
Wendy Hui Kyong Chun; On Software, or the Persistence of Visual Knowledge. Grey Room 2005; (18): 26–51. doi: https://doi.org/10.1162/1526381043320741
Component Variables
A plugin that helps customize Figma components in an orderly and automatic manner. Create and edit preset variables within your component without the hassle of going through groups and autolayouts. __________________ HOW TO USE • TEXT VARIABLES Assign a variable name to a text layer and chang...
Reticulum Network
For the better part of a generation, we have been taught to visualize the digital world through the lens of hierarchy. The mental maps we carry are dominated by a single, misleading image: The Cloud.

variables2css
Convert Figma design variables, including colors and numbers, into CSS, Sass, Tailwind, Stylus, Json, Less or Javascript (Styled-Components) variables to save time and ensure accuracy. Use it in Figma: Design and Development mode. How to use it: Select your collection and now also choose specifi...
ggtime: A Grammar of Temporal Graphics
Visualizing changes over time is fundamental to learning from the past and anticipating the future. However, temporal semantics can be complicated, and existing visualization tools often struggle to accurately represent these complexities. It is common to use bespoke plot helper functions designed to produce specific graphics, due to the absence of flexible general tools that respect temporal semantics. We address this problem by proposing a grammar of temporal graphics, and an associated software implementation, 'ggtime', that encodes temporal semantics into a declarative grammar for visualizing temporal data. The grammar introduces new composable elements that support visualization across linear, cyclical, quasi-cyclical, and other granularities; standardization of irregular durations; and alignment of time points across different granularities and time zones. It is designed for interoperability with other semantic variables, allowing navigation across the space of visualizations while preserving temporal semantics.

GitHub - observablehq/plot: A concise API for exploratory data visualization implementing a layered grammar of graphics
A concise API for exploratory data visualization implementing a layered grammar of graphics - observablehq/plot
Sound & Vision
Explore the future of type with the Re:Vision 2025 typographic playground—an interactive showcase of emerging type trends. Dive in and shape the next wave of visual language.